Percent of Population in Lowest Two Wealth Quintiles
This indicator represents the percent of population in lowest two wealth quintiles
Prevalence map
Baseline
Latest
2015
2022
Width of 90% Confidence Interval
Baseline
Latest
2015
2022
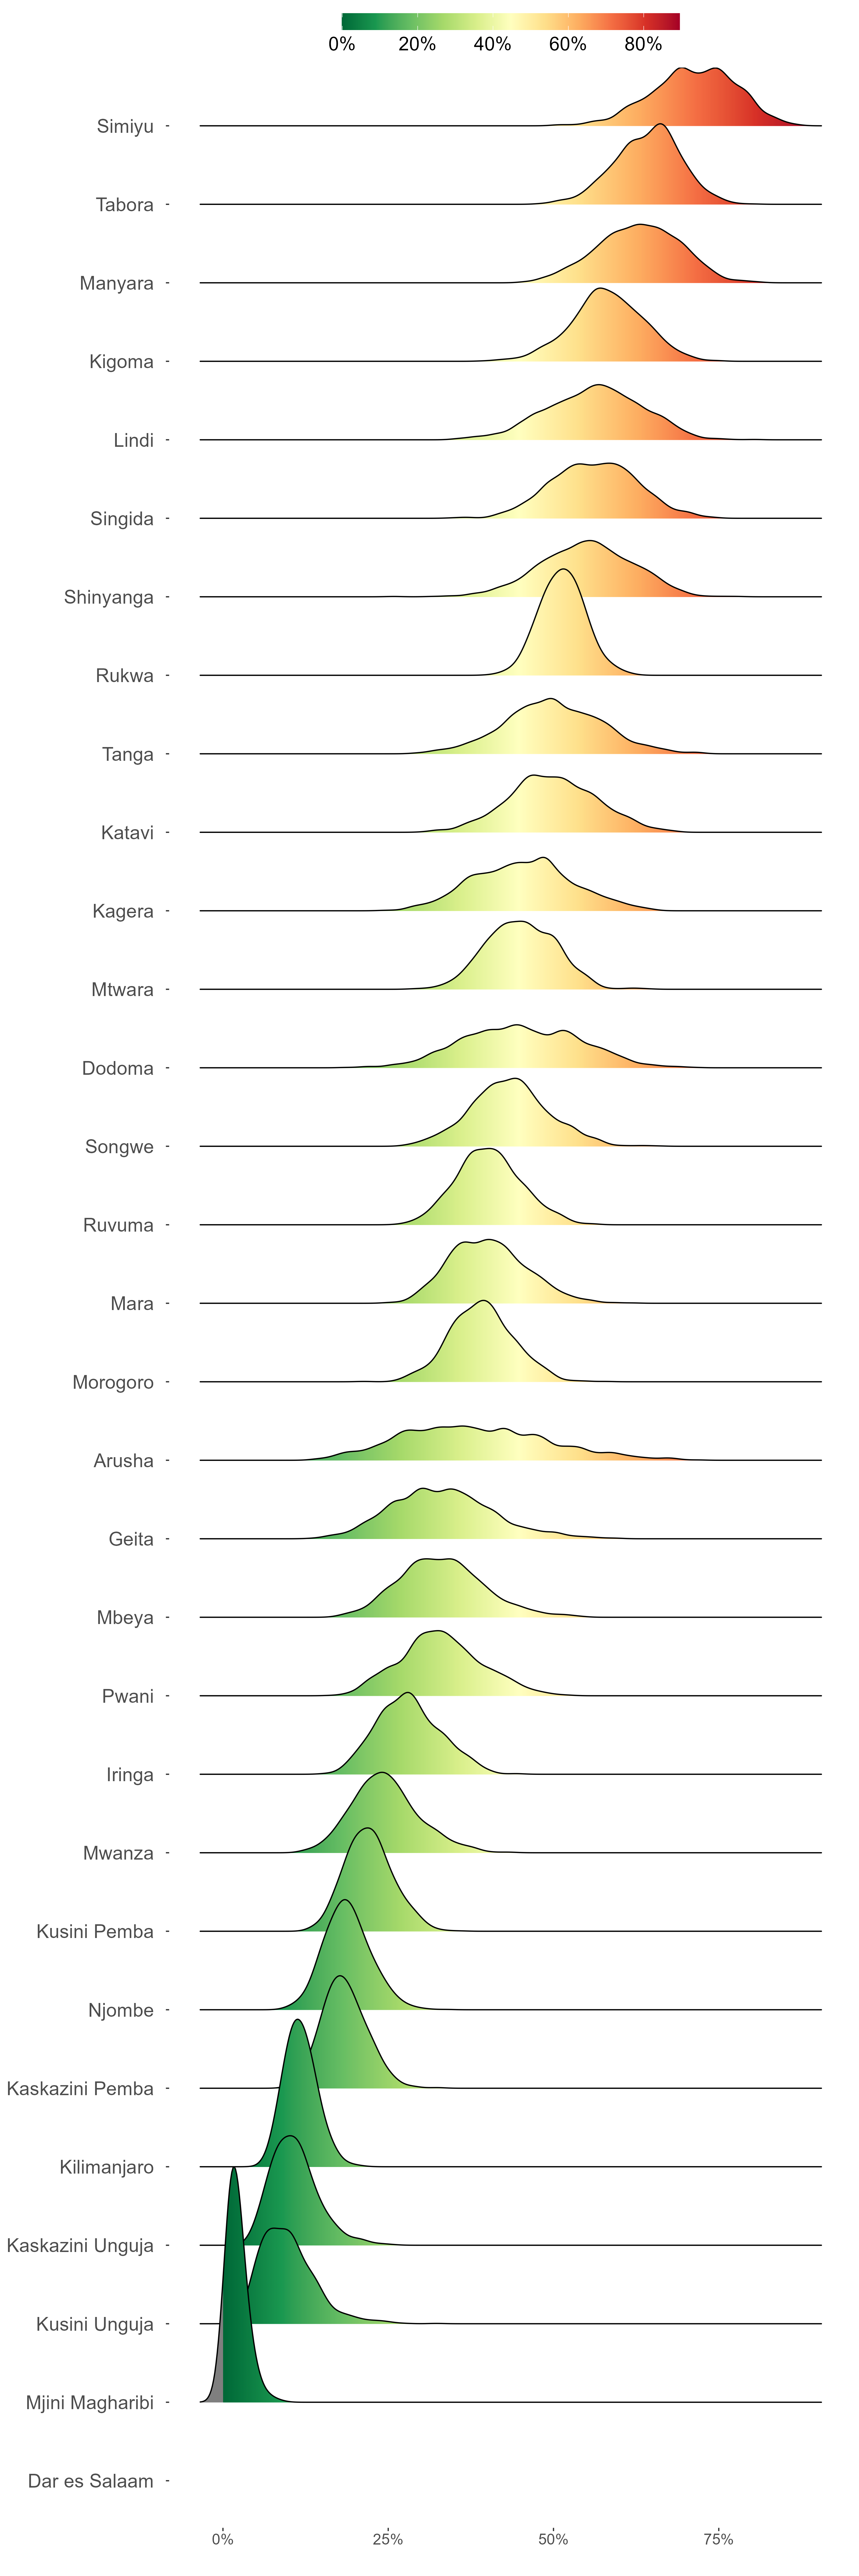
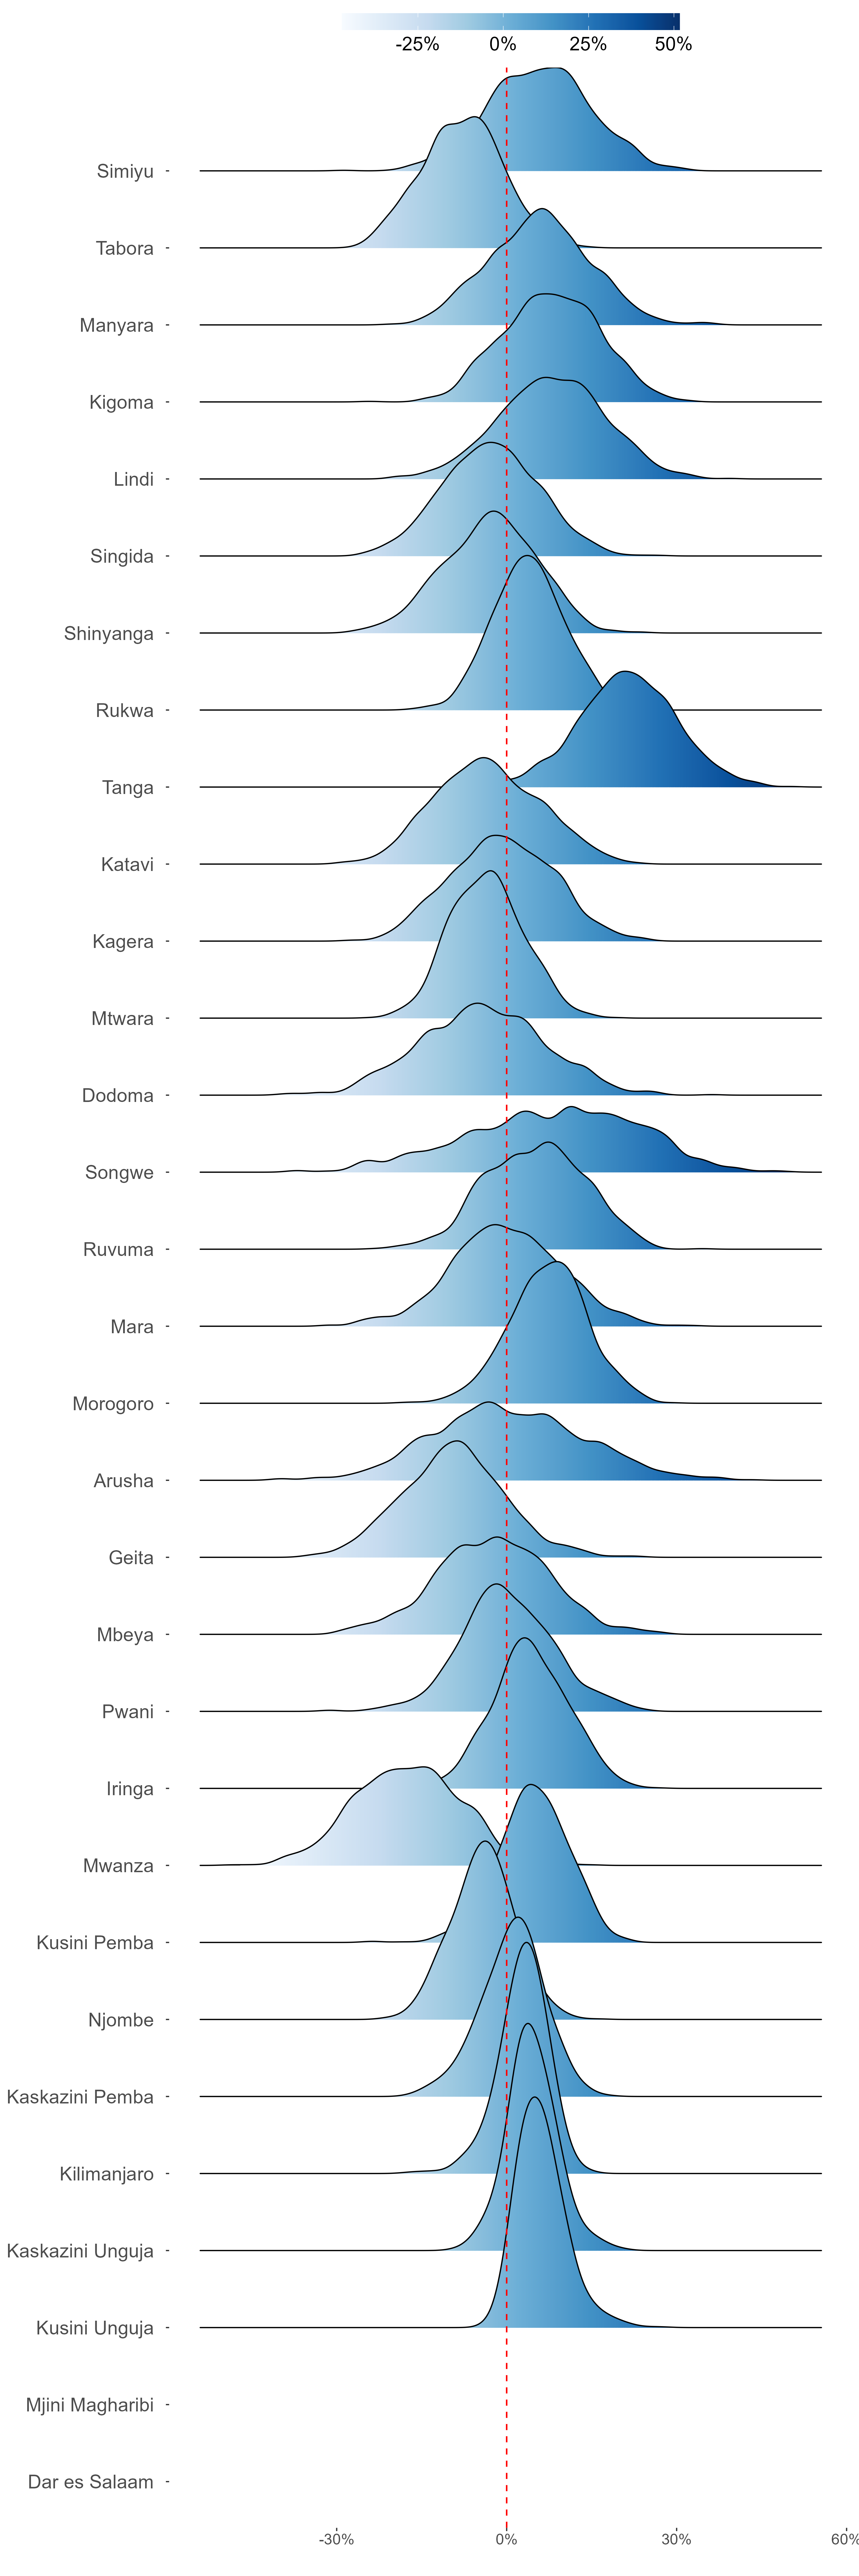
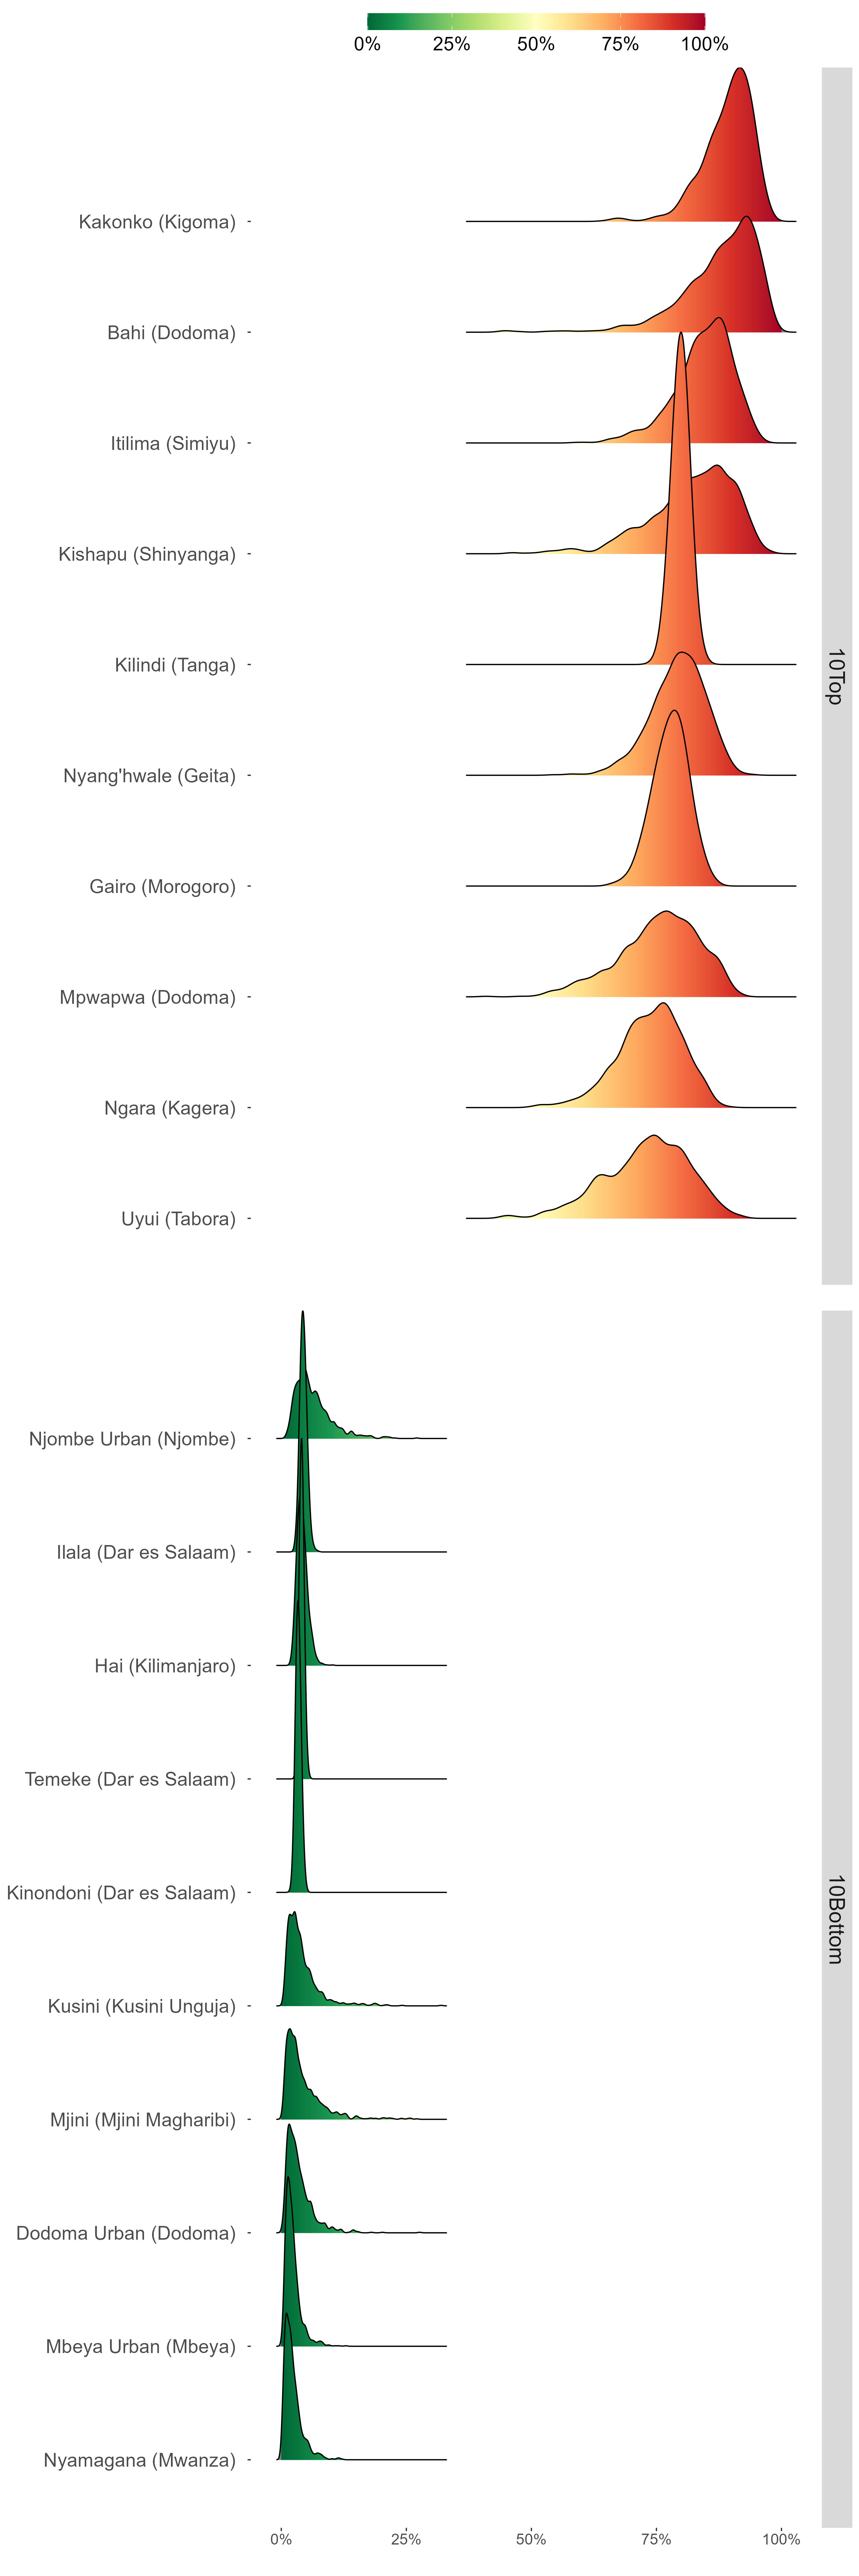
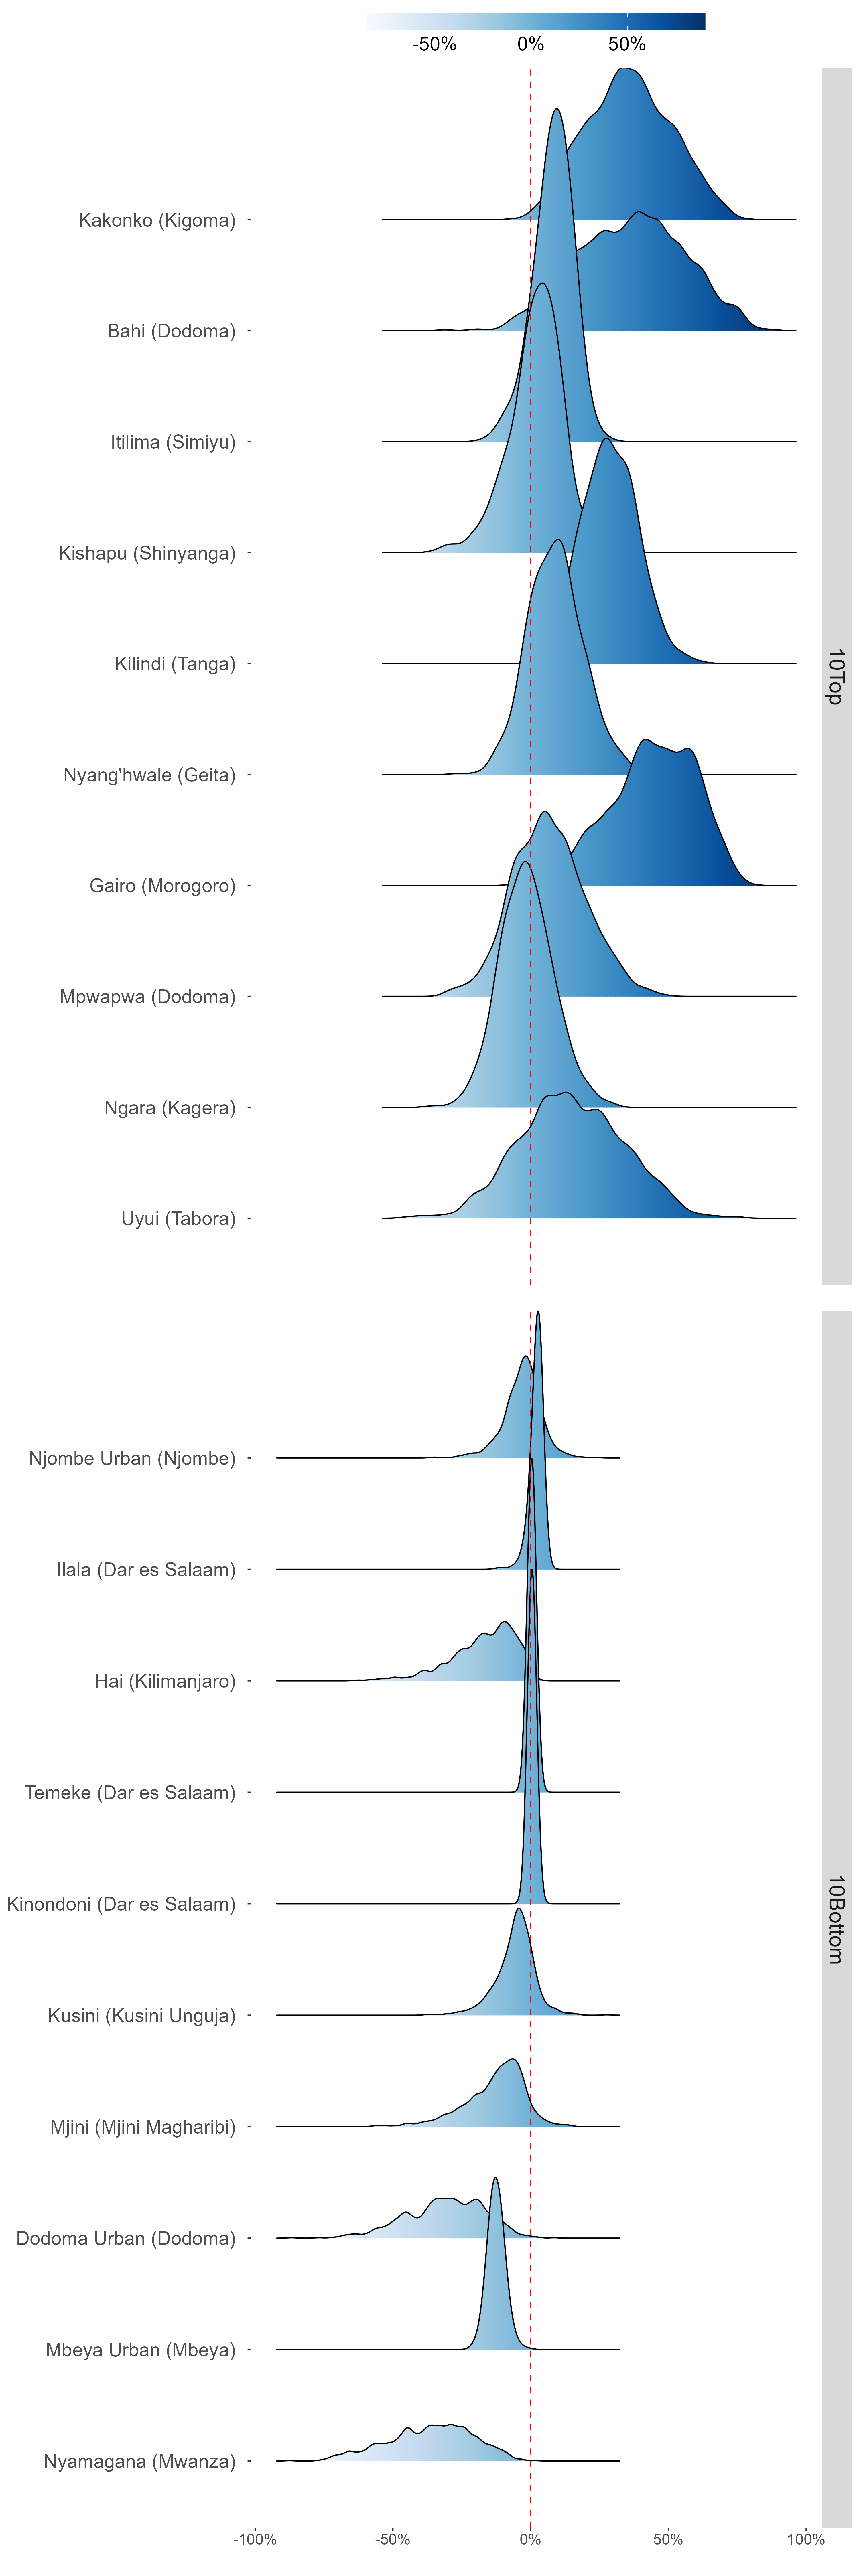
Ridge Plot
Latest regions estimates
Regions change since baseline


Latest districts estimates
Districts change since baseline

