Place of Delivery: Health Facility
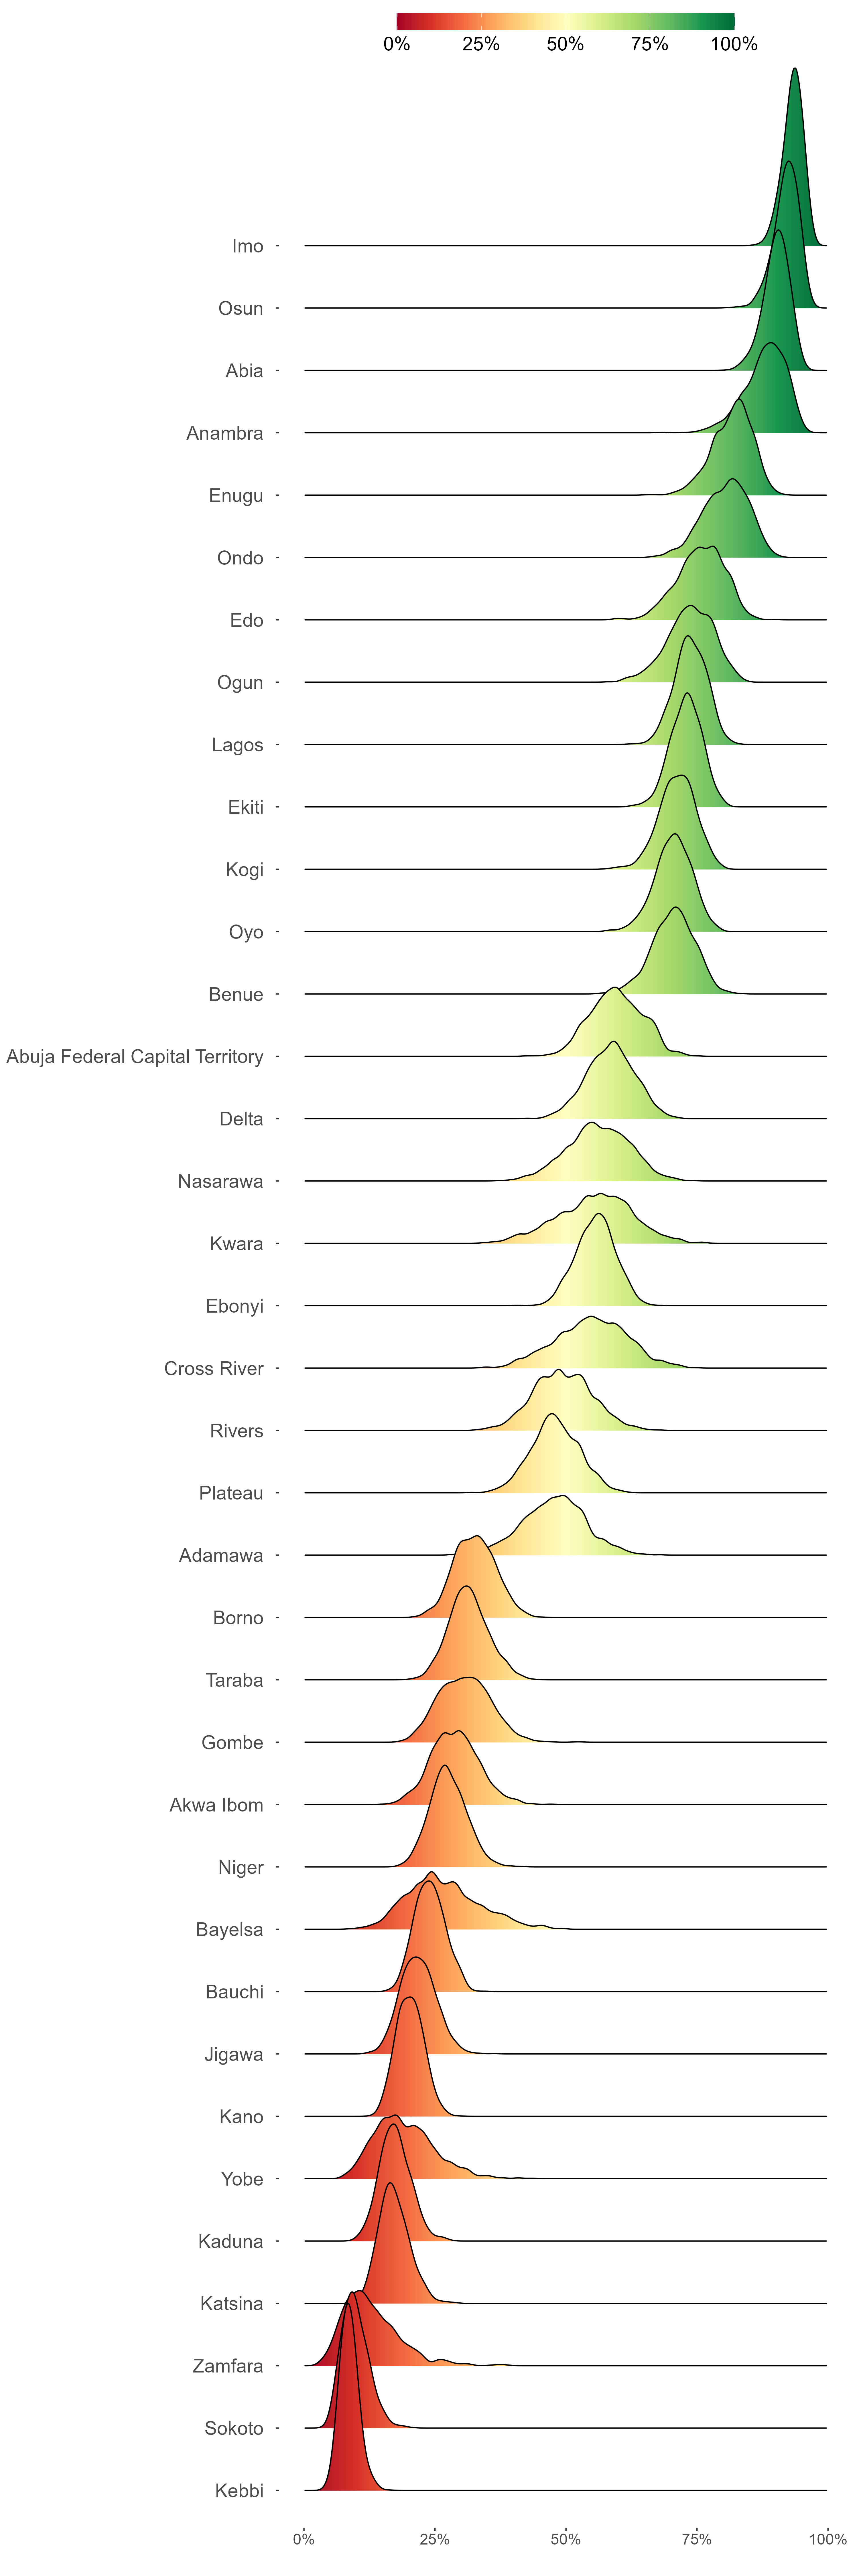
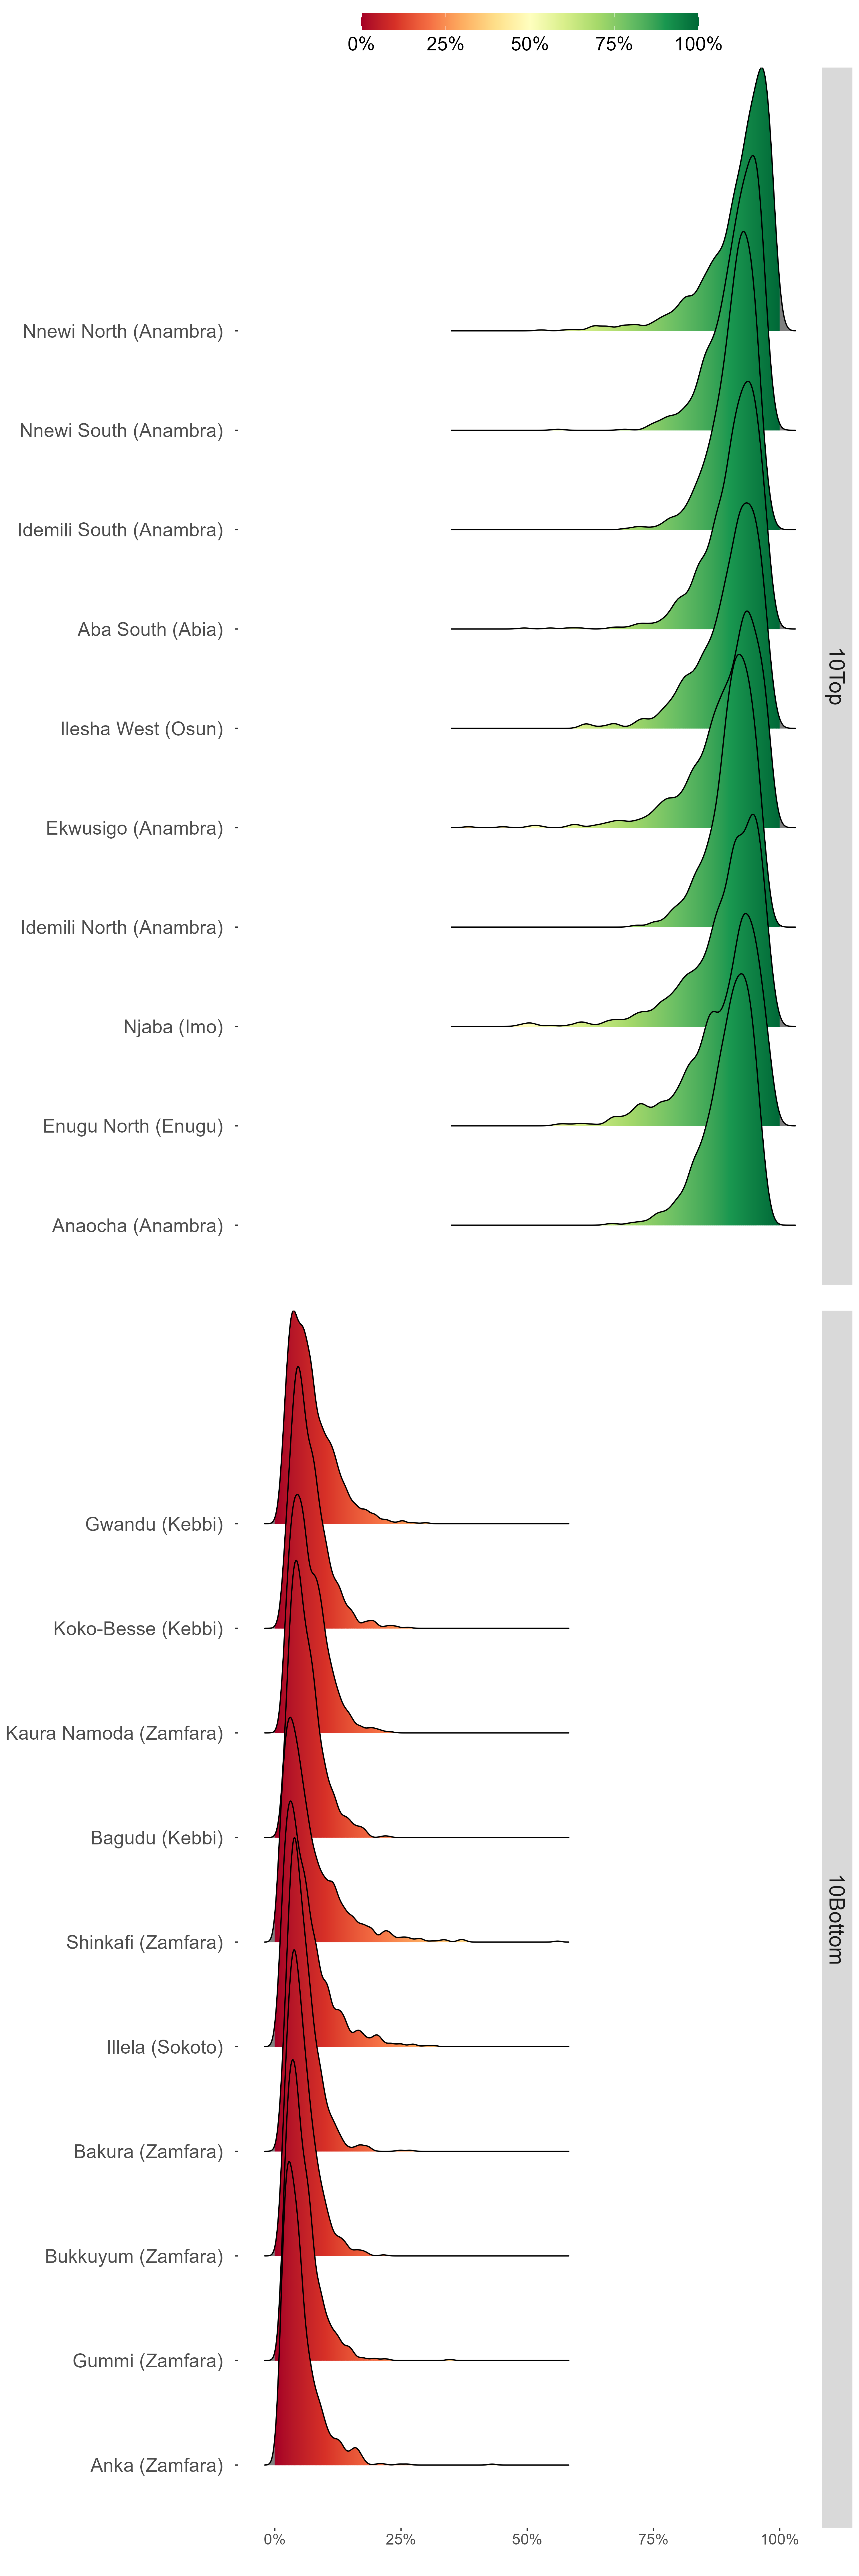
This indicator represents the percentage of live births in the five years preceding the survey delivered at a health facility
Prevalence map
Baseline
Latest
2018
2024
Width of 90% Confidence Interval
Baseline
Latest
2018
2024
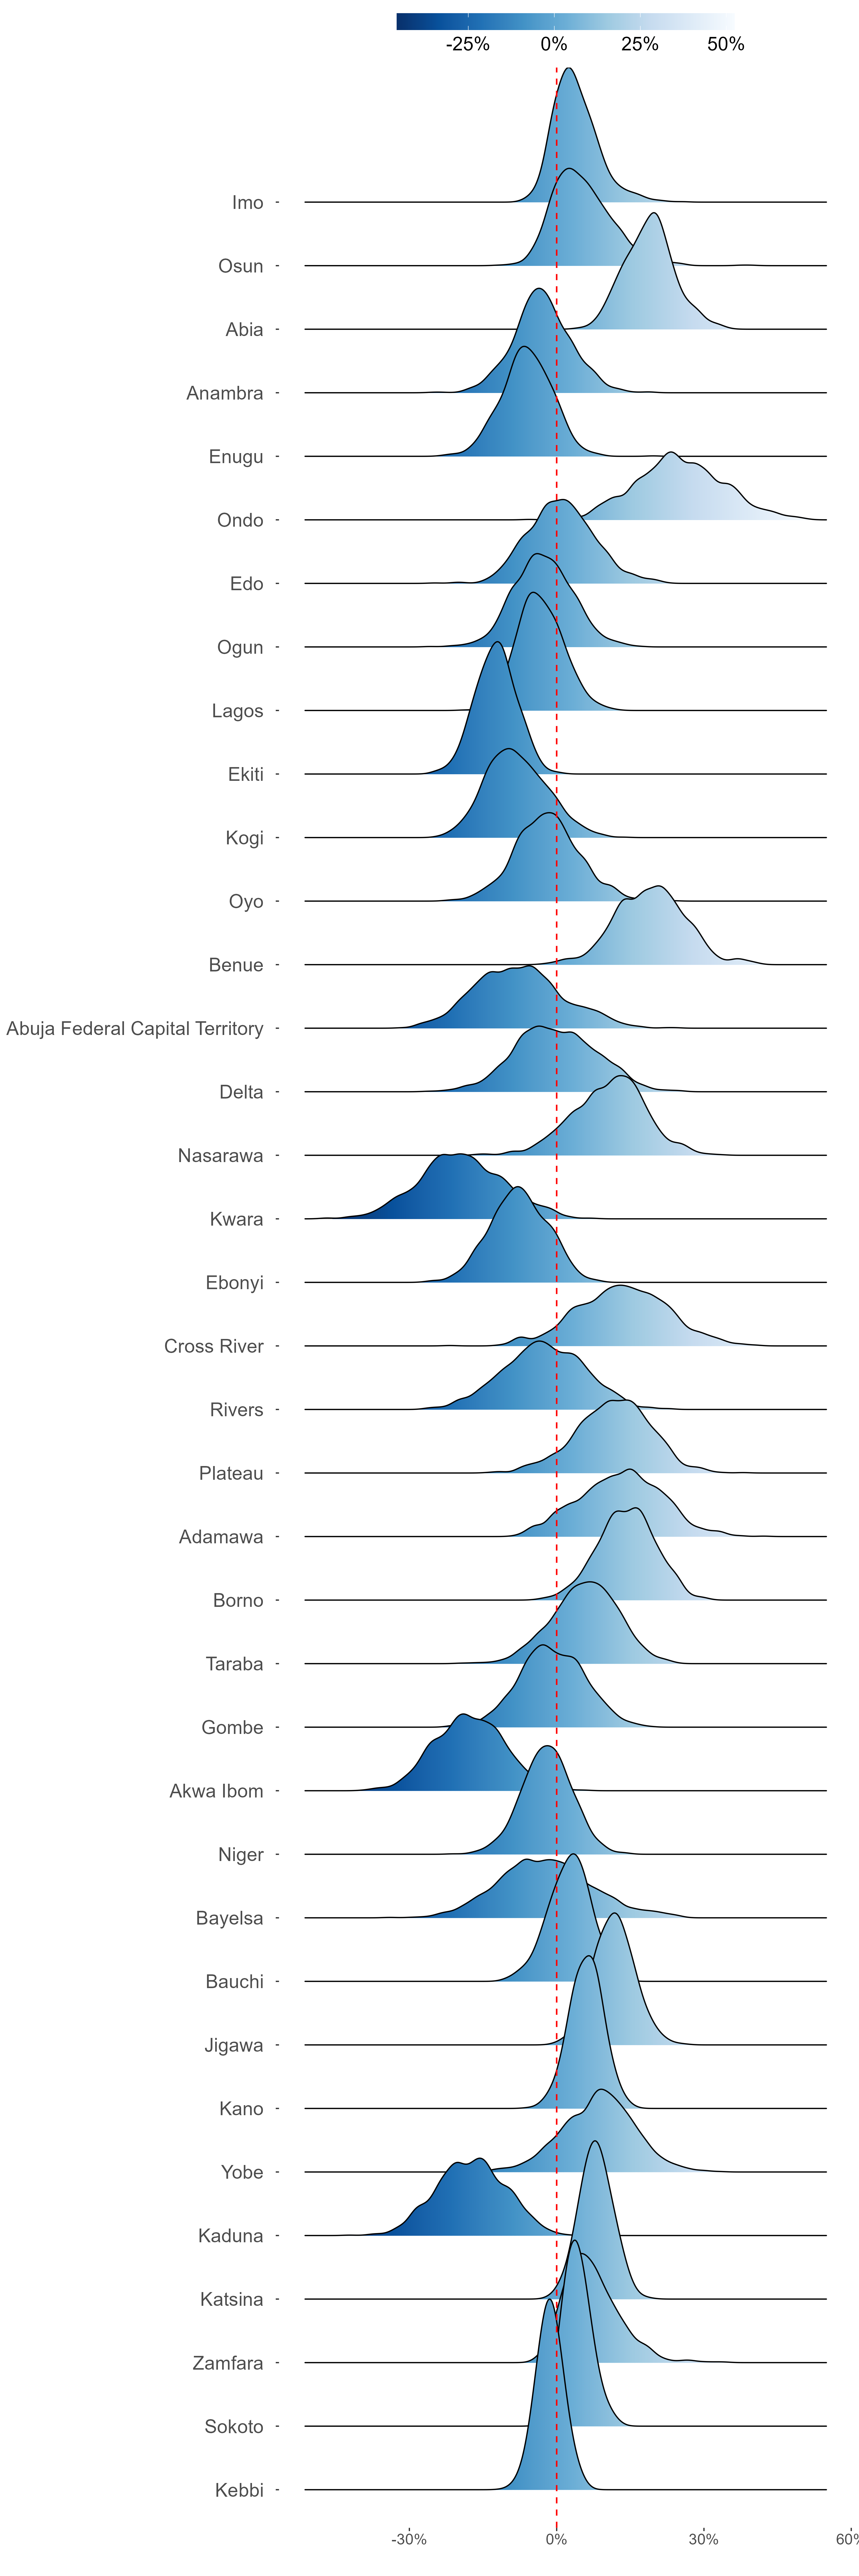
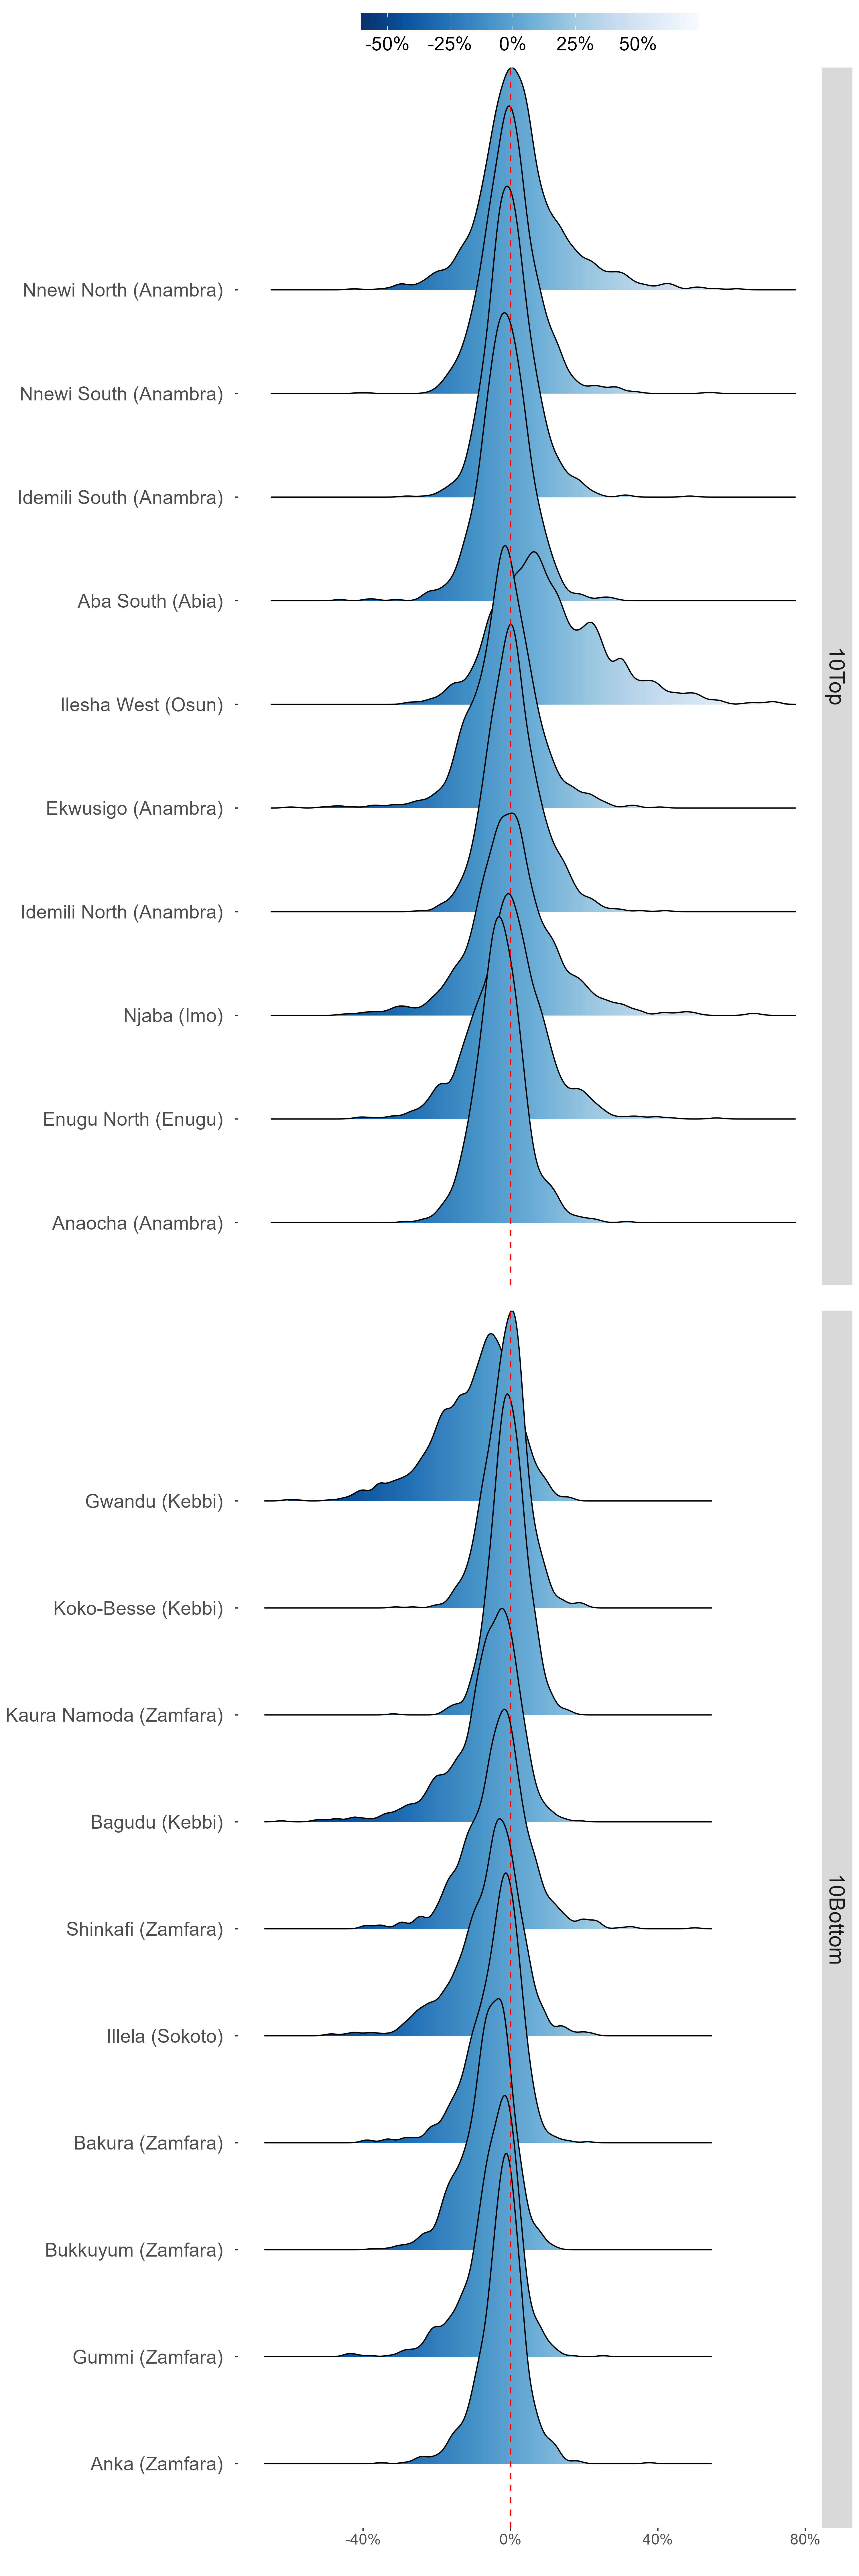
Ridge Plot
Latest states estimates
States change since Baseline


Latest LGA estimates
LGA change since Baseline

