Percent of Population in Lowest Two Wealth Quintiles
This indicator represents the percent of population in lowest two wealth quintiles
Prevalence map
Baseline
Latest
2018
2024
Width of 90% Confidence Interval
Baseline
Latest
2018
2024
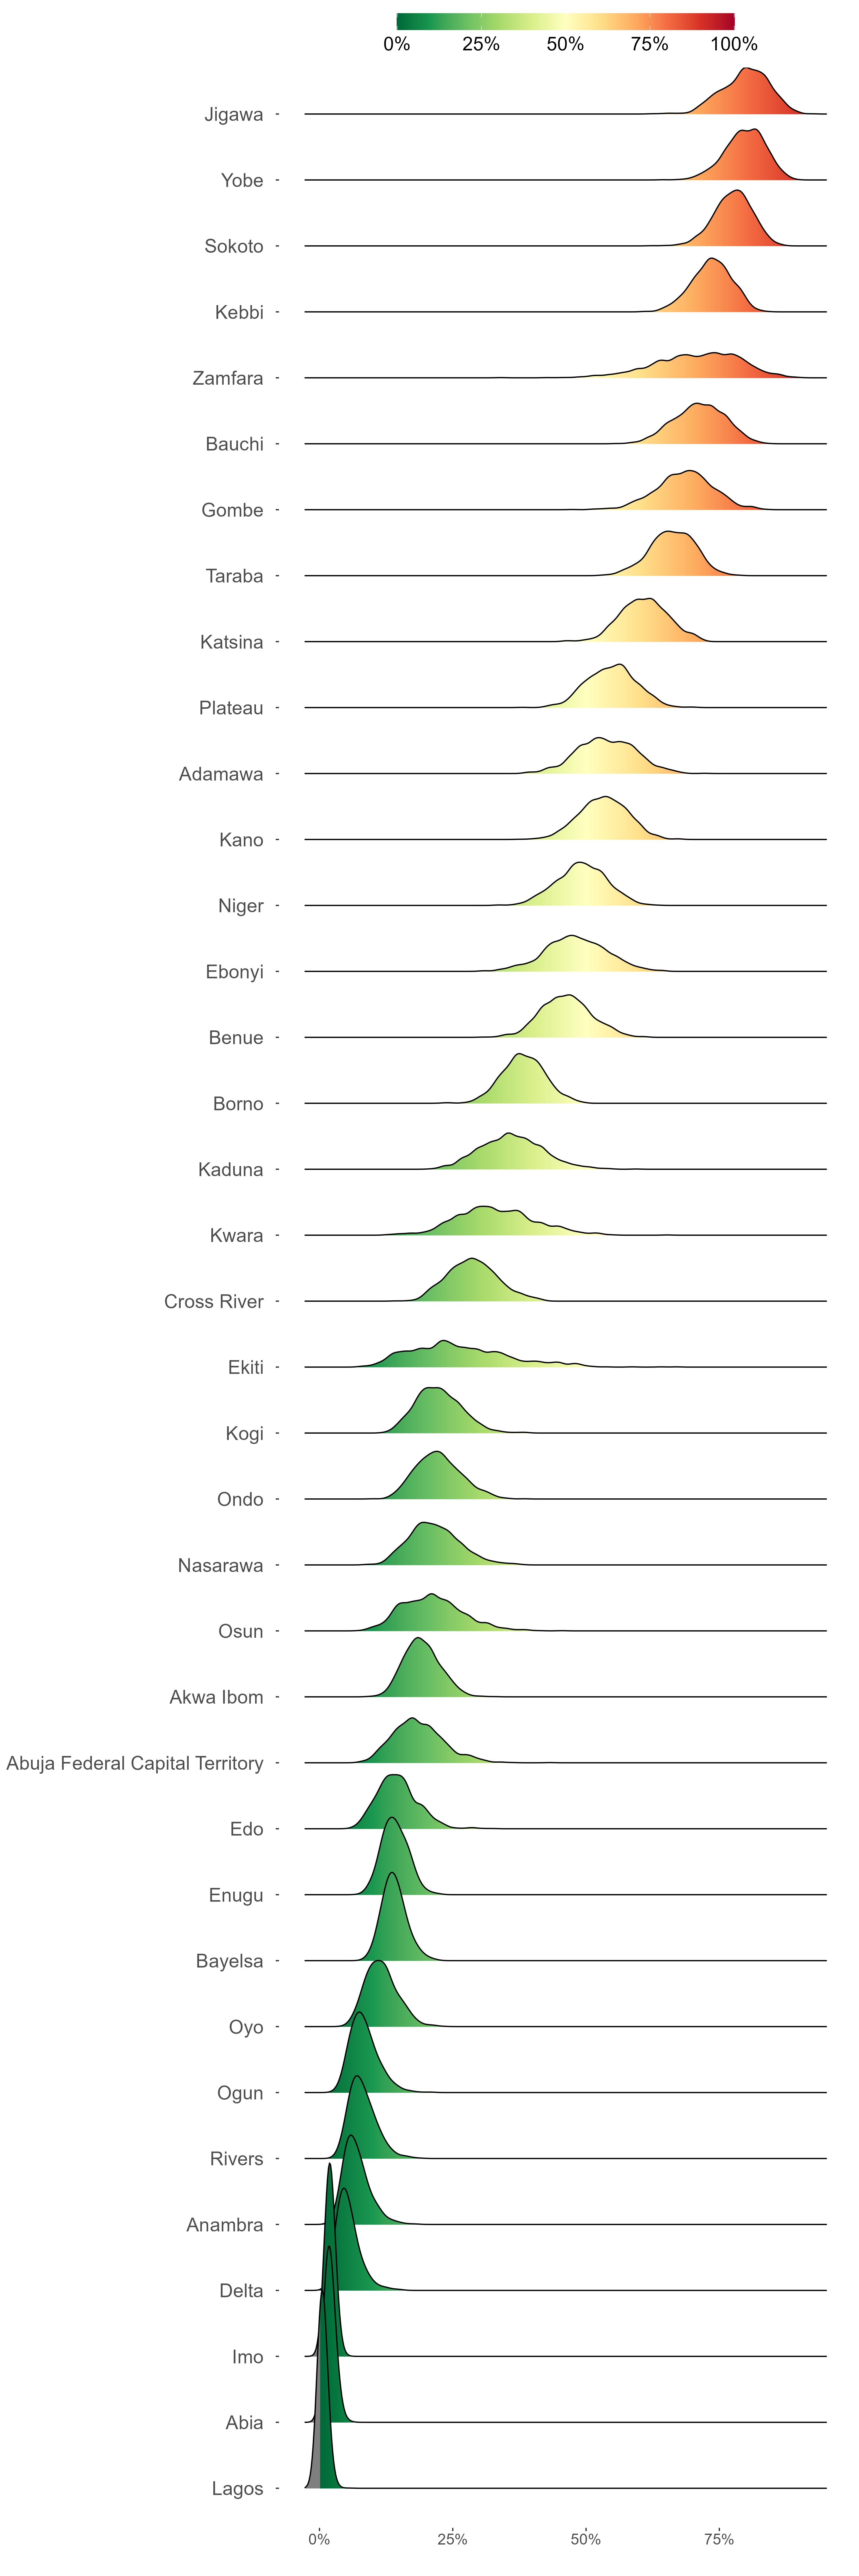
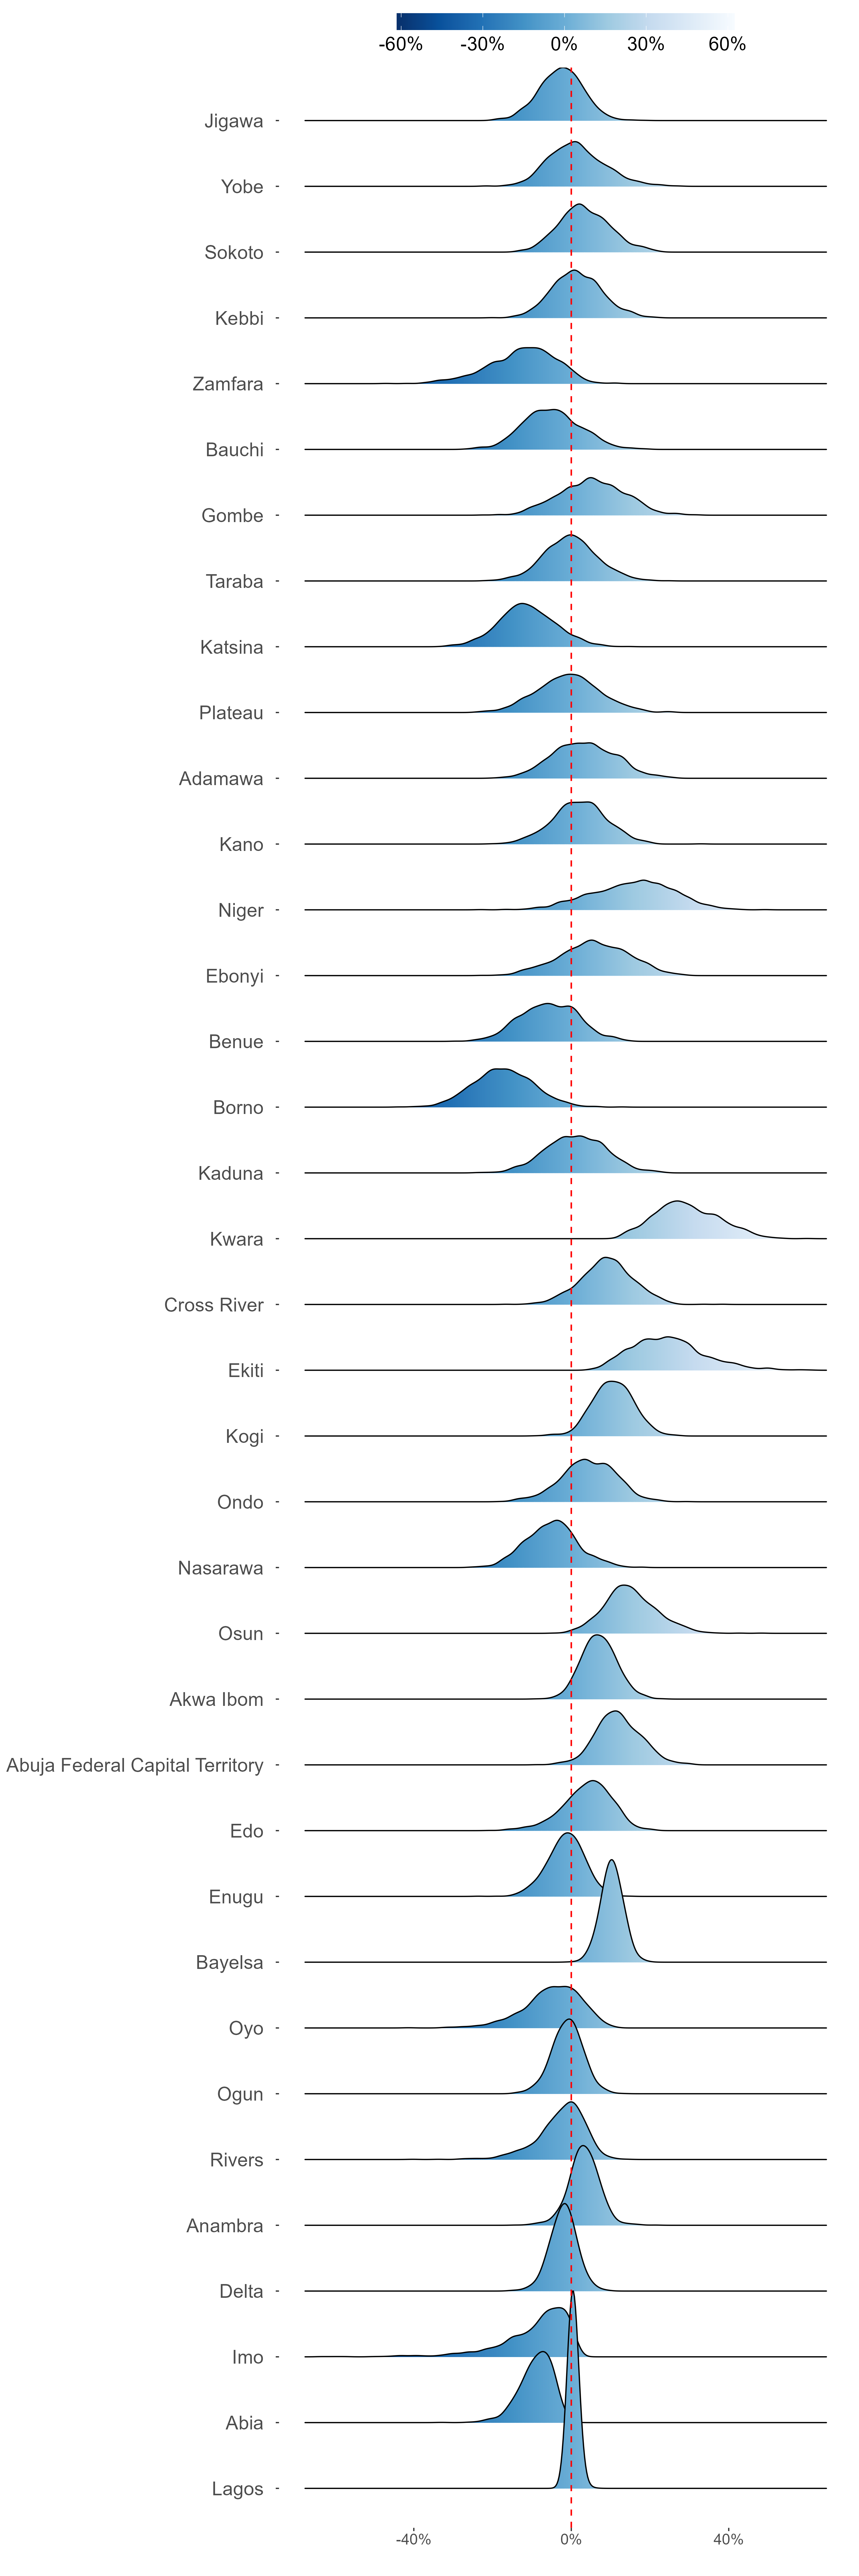
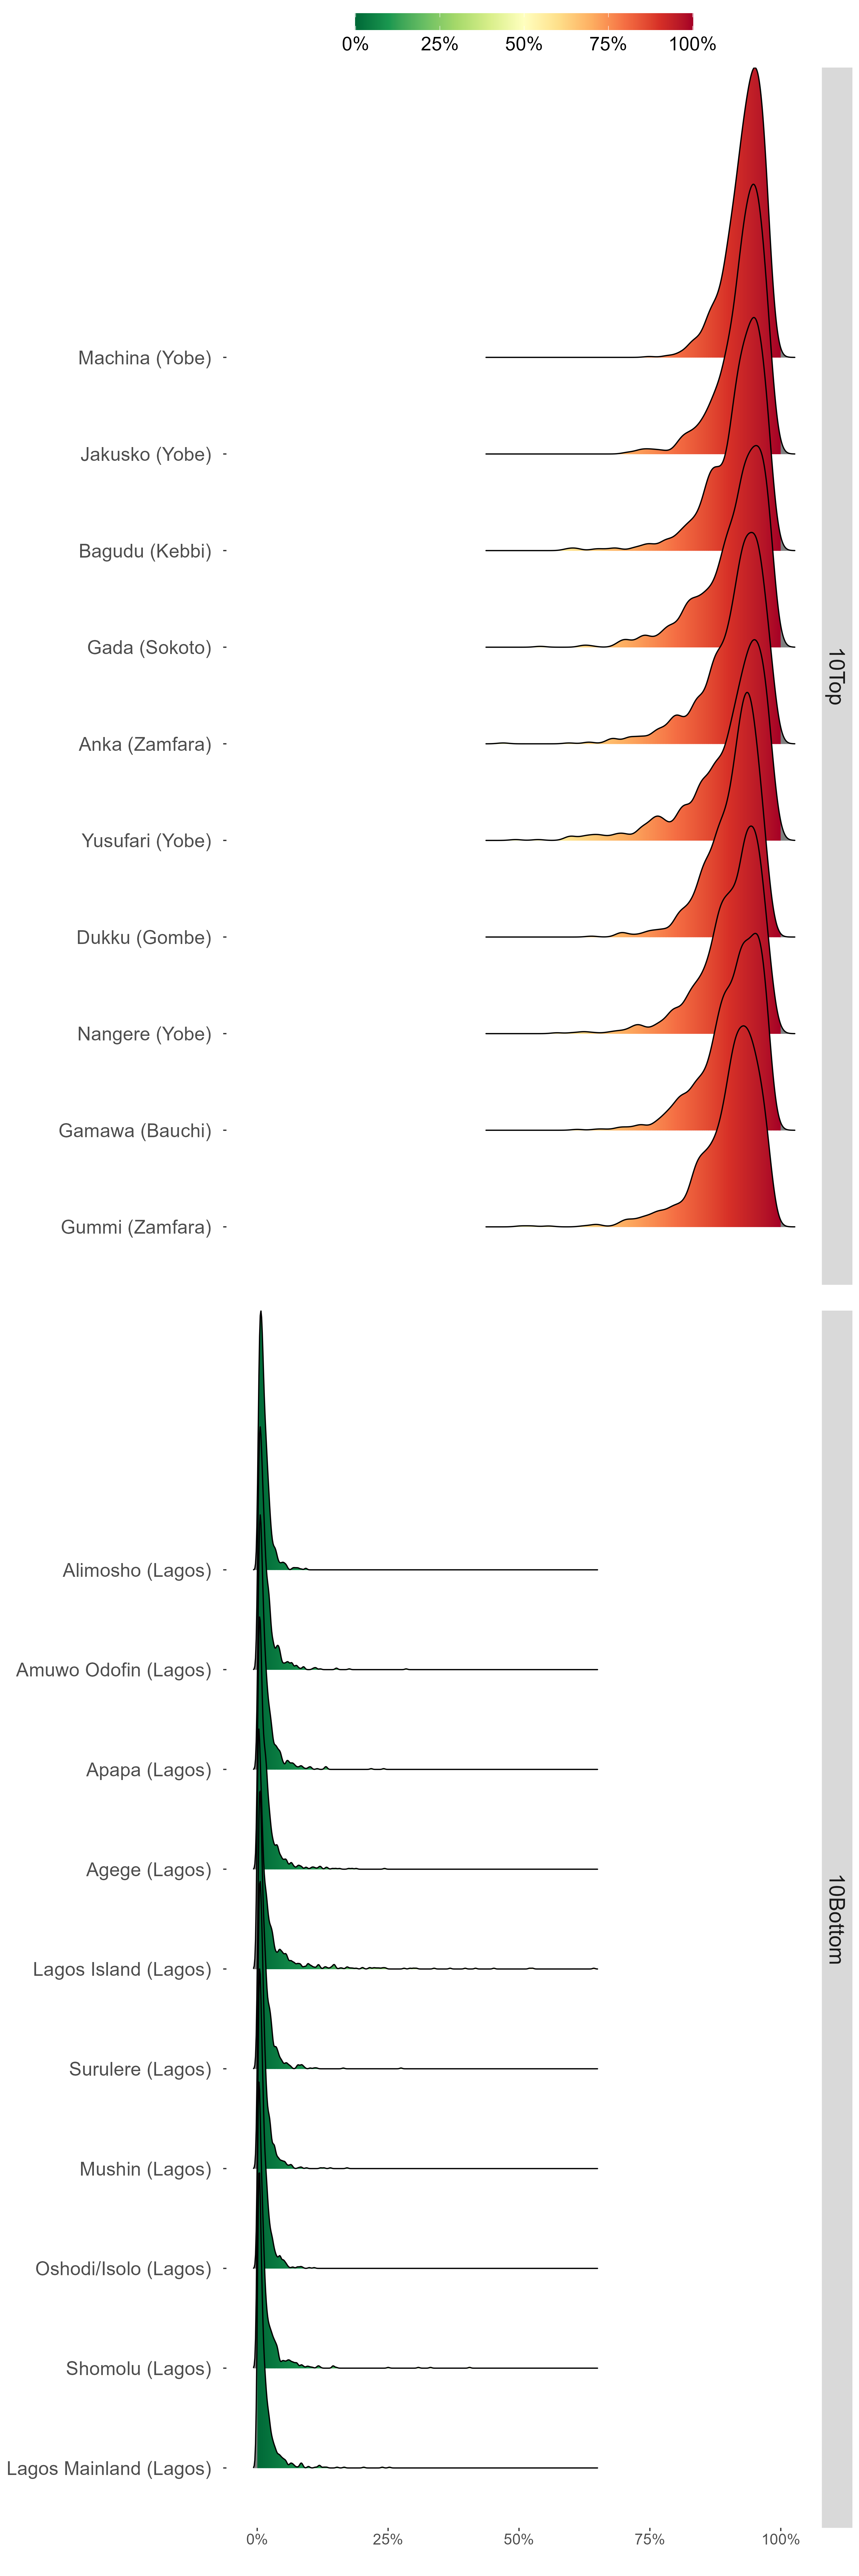
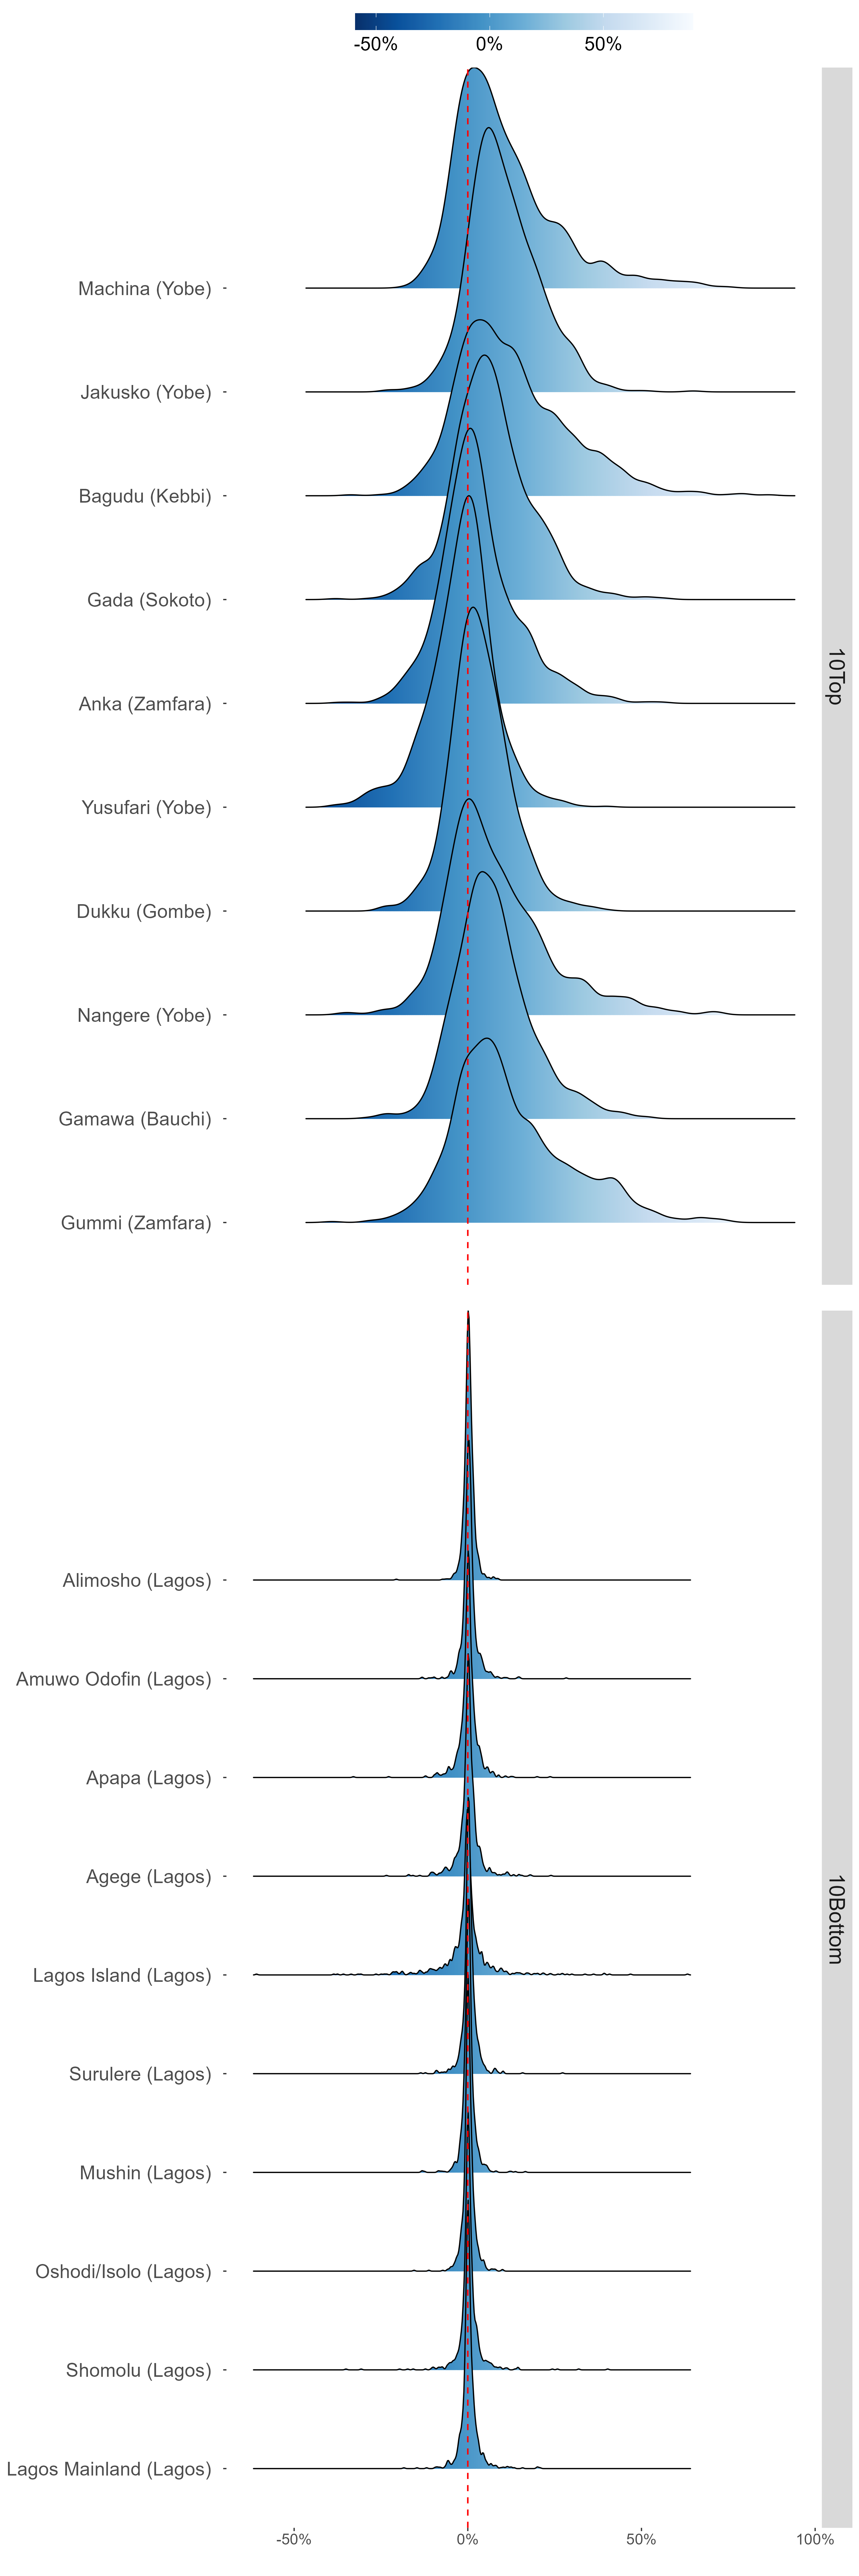
Ridge Plot
Latest states estimates
States change since Baseline


Latest LGA estimates
LGA change since Baseline

