Stunting rate
This indicator represents the percentage of children stunted (below -2 SD of height for age according to the WHO standard)
Prevalence map
Baseline
Latest
2018
2024
Width of 90% Confidence Interval
Baseline
Latest
2018
2024
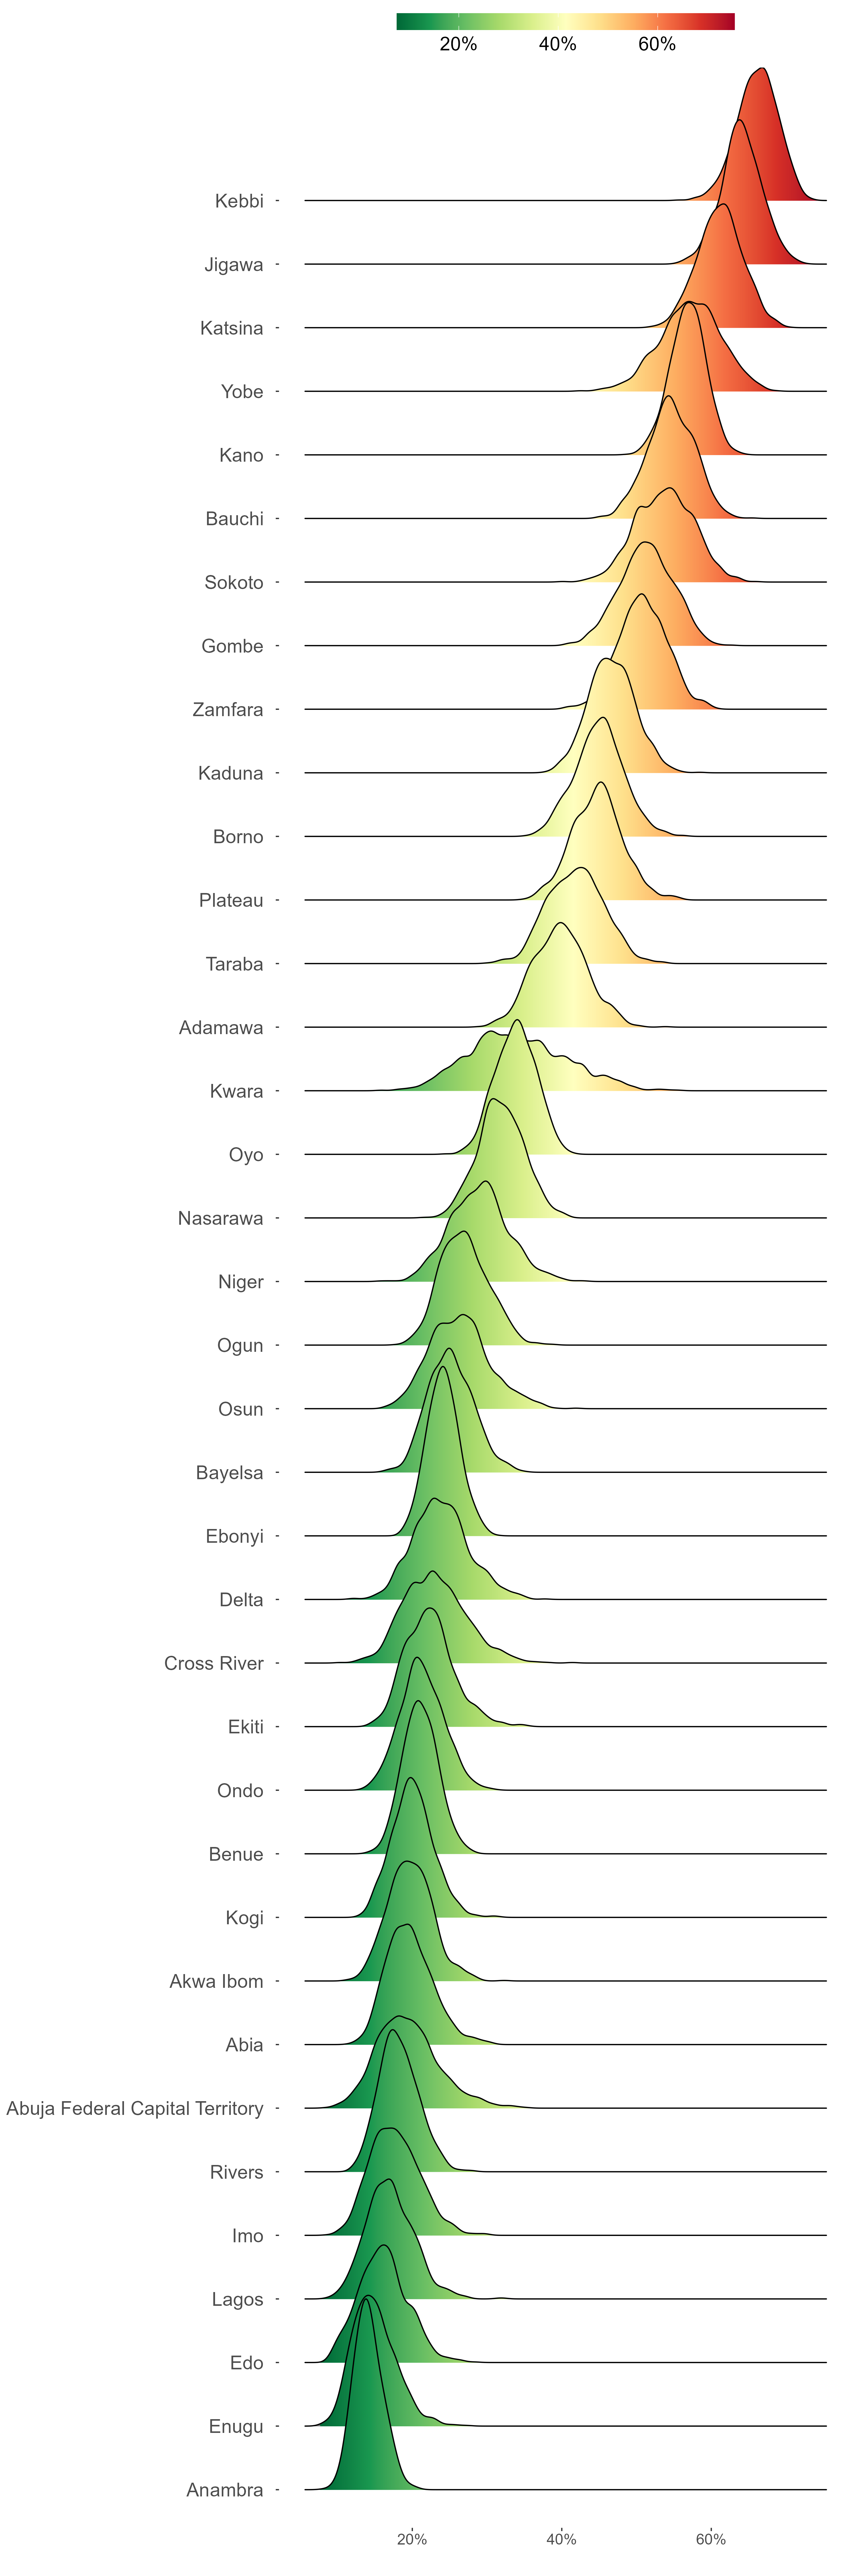
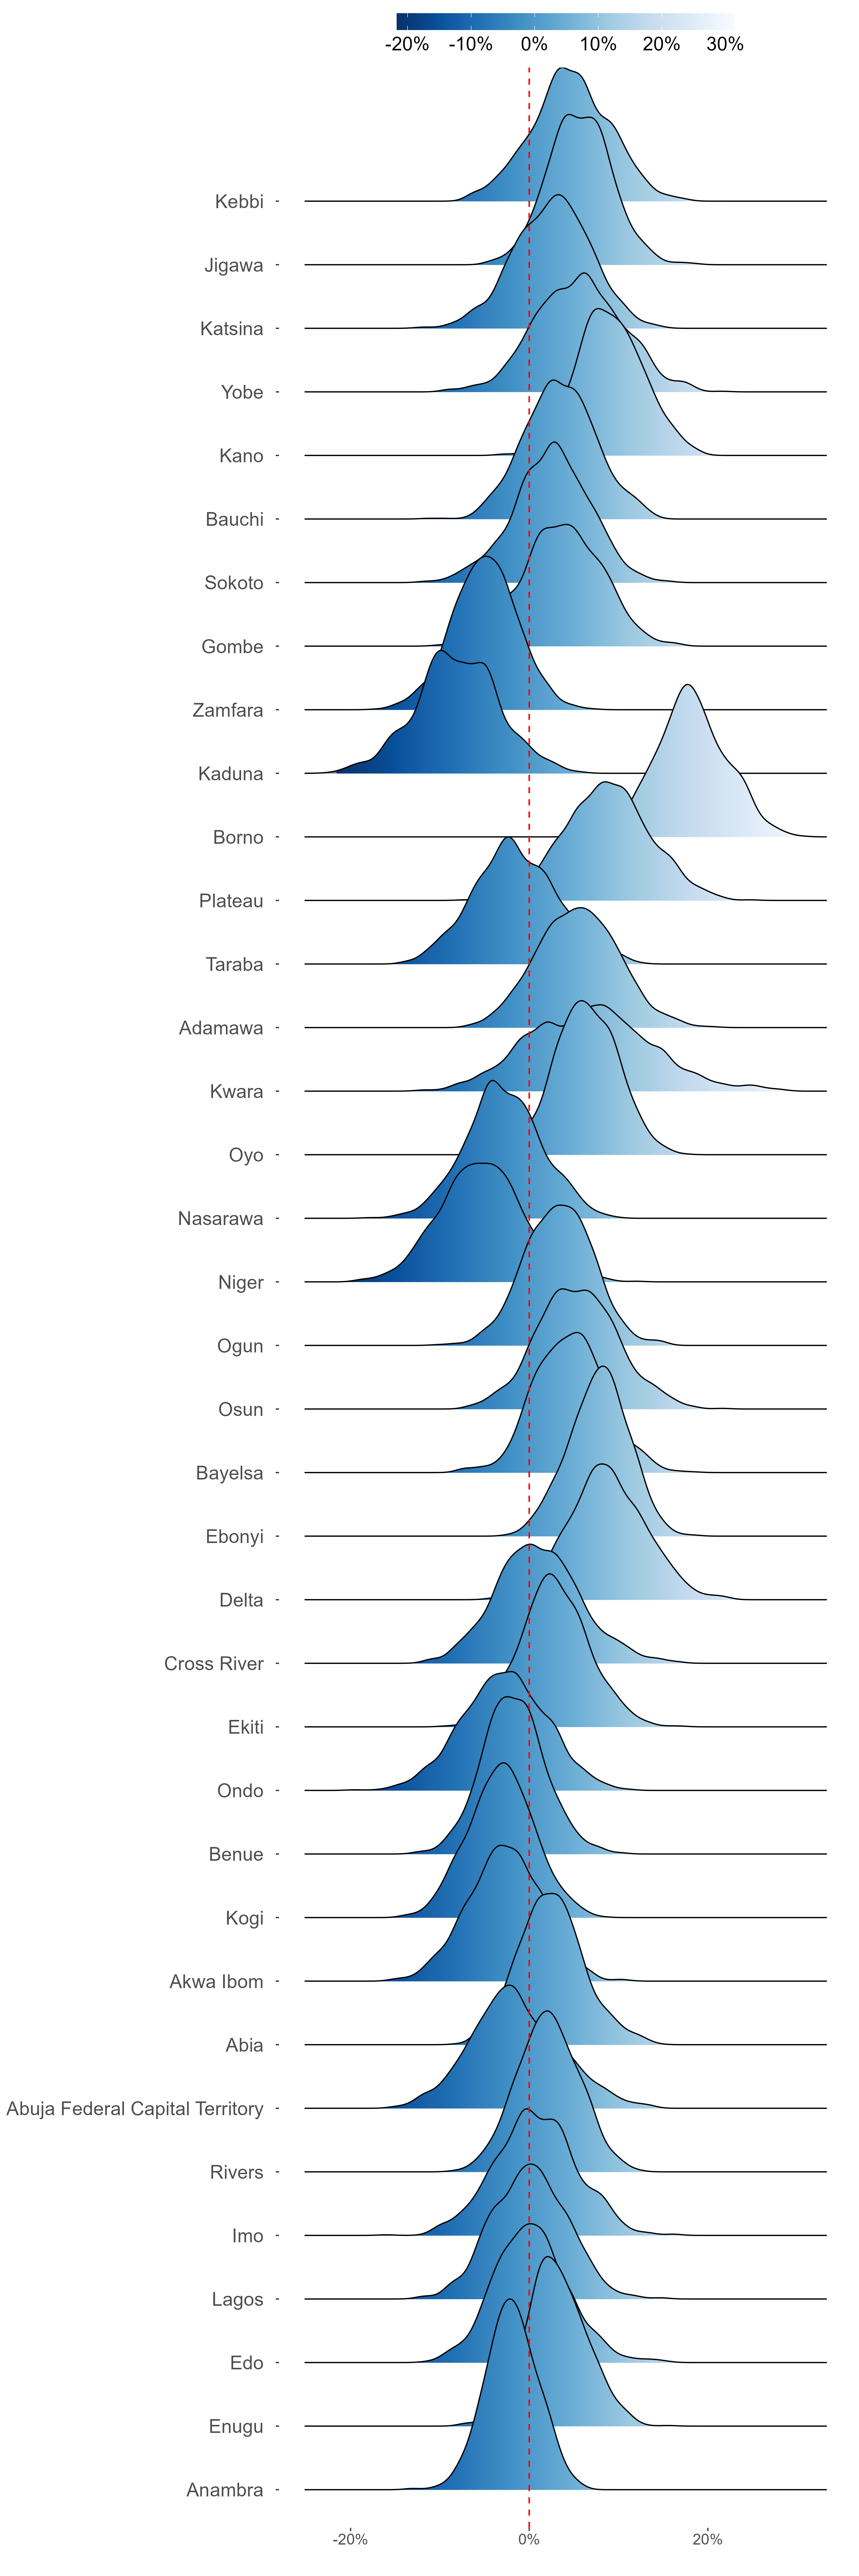
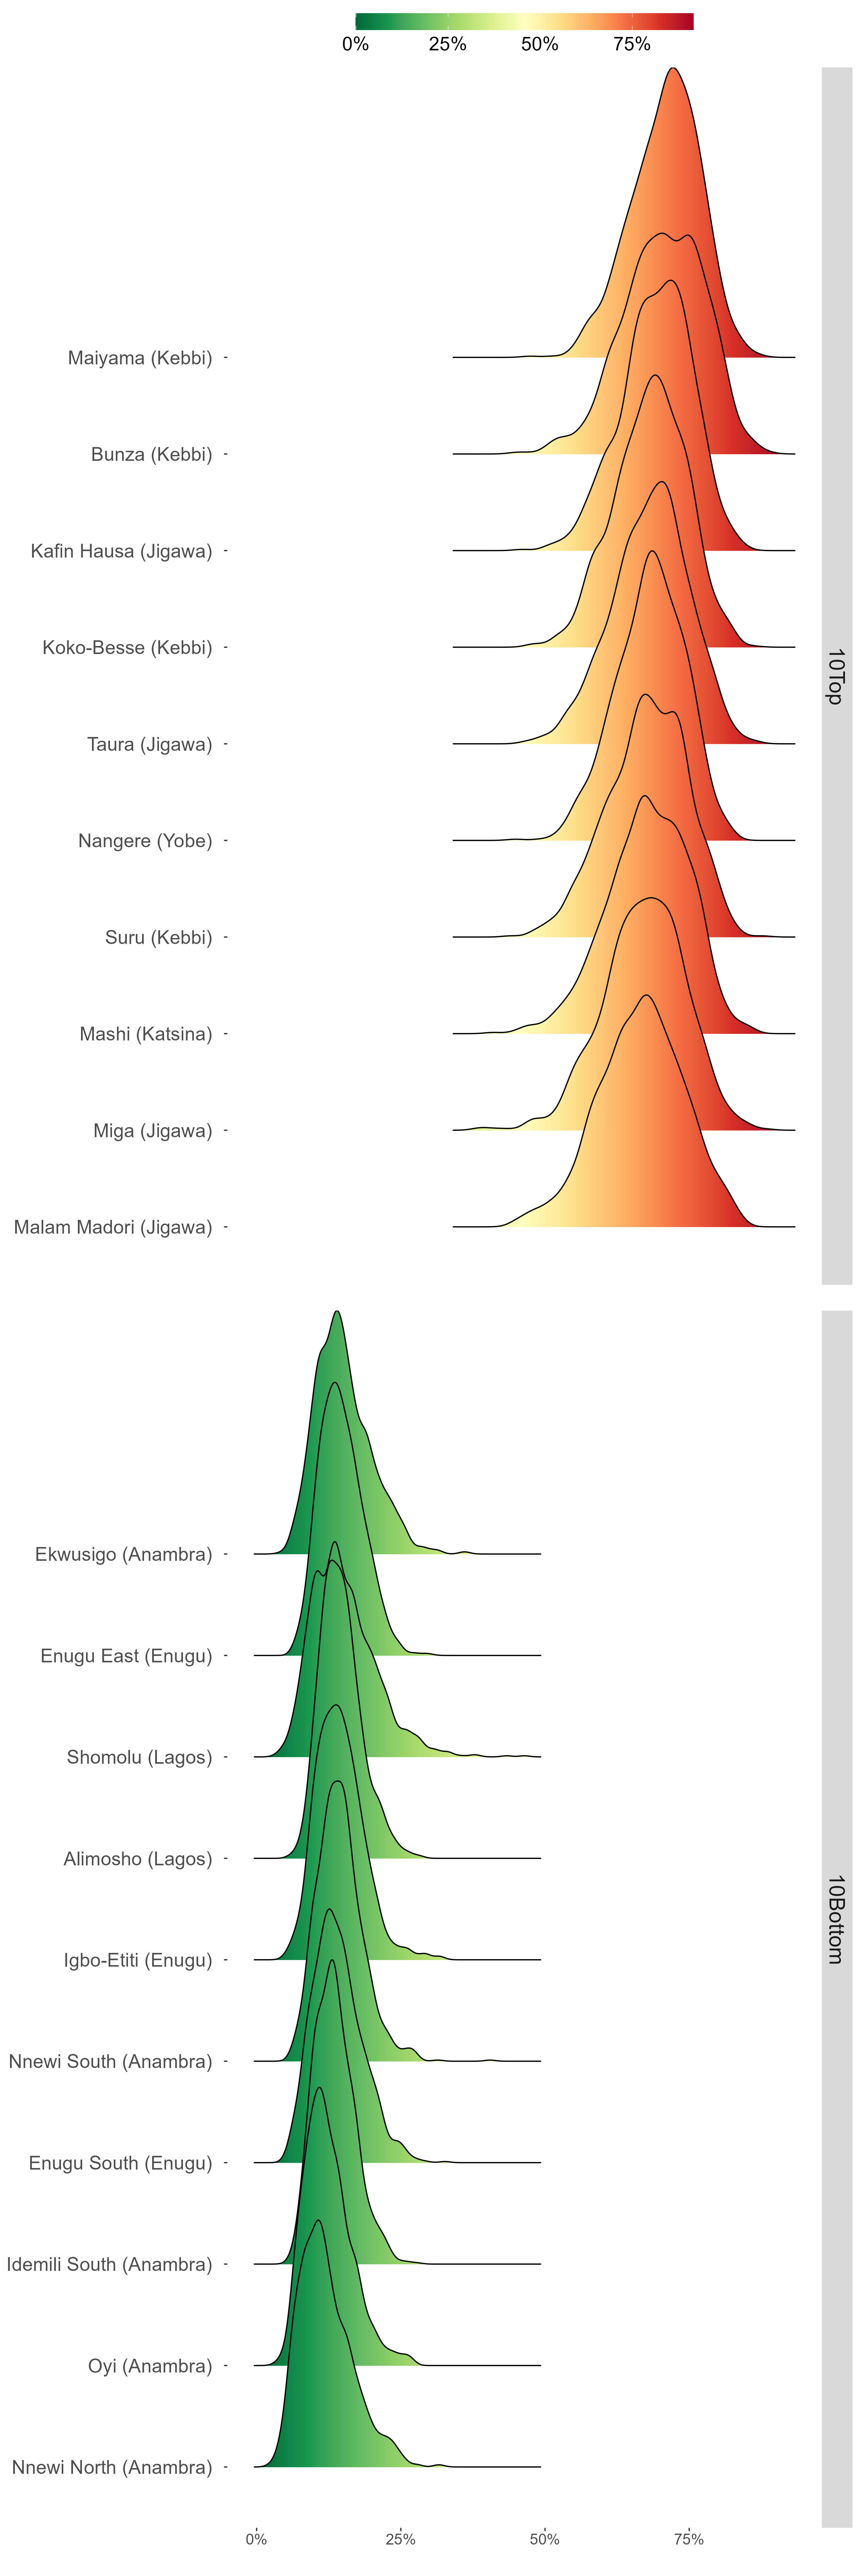
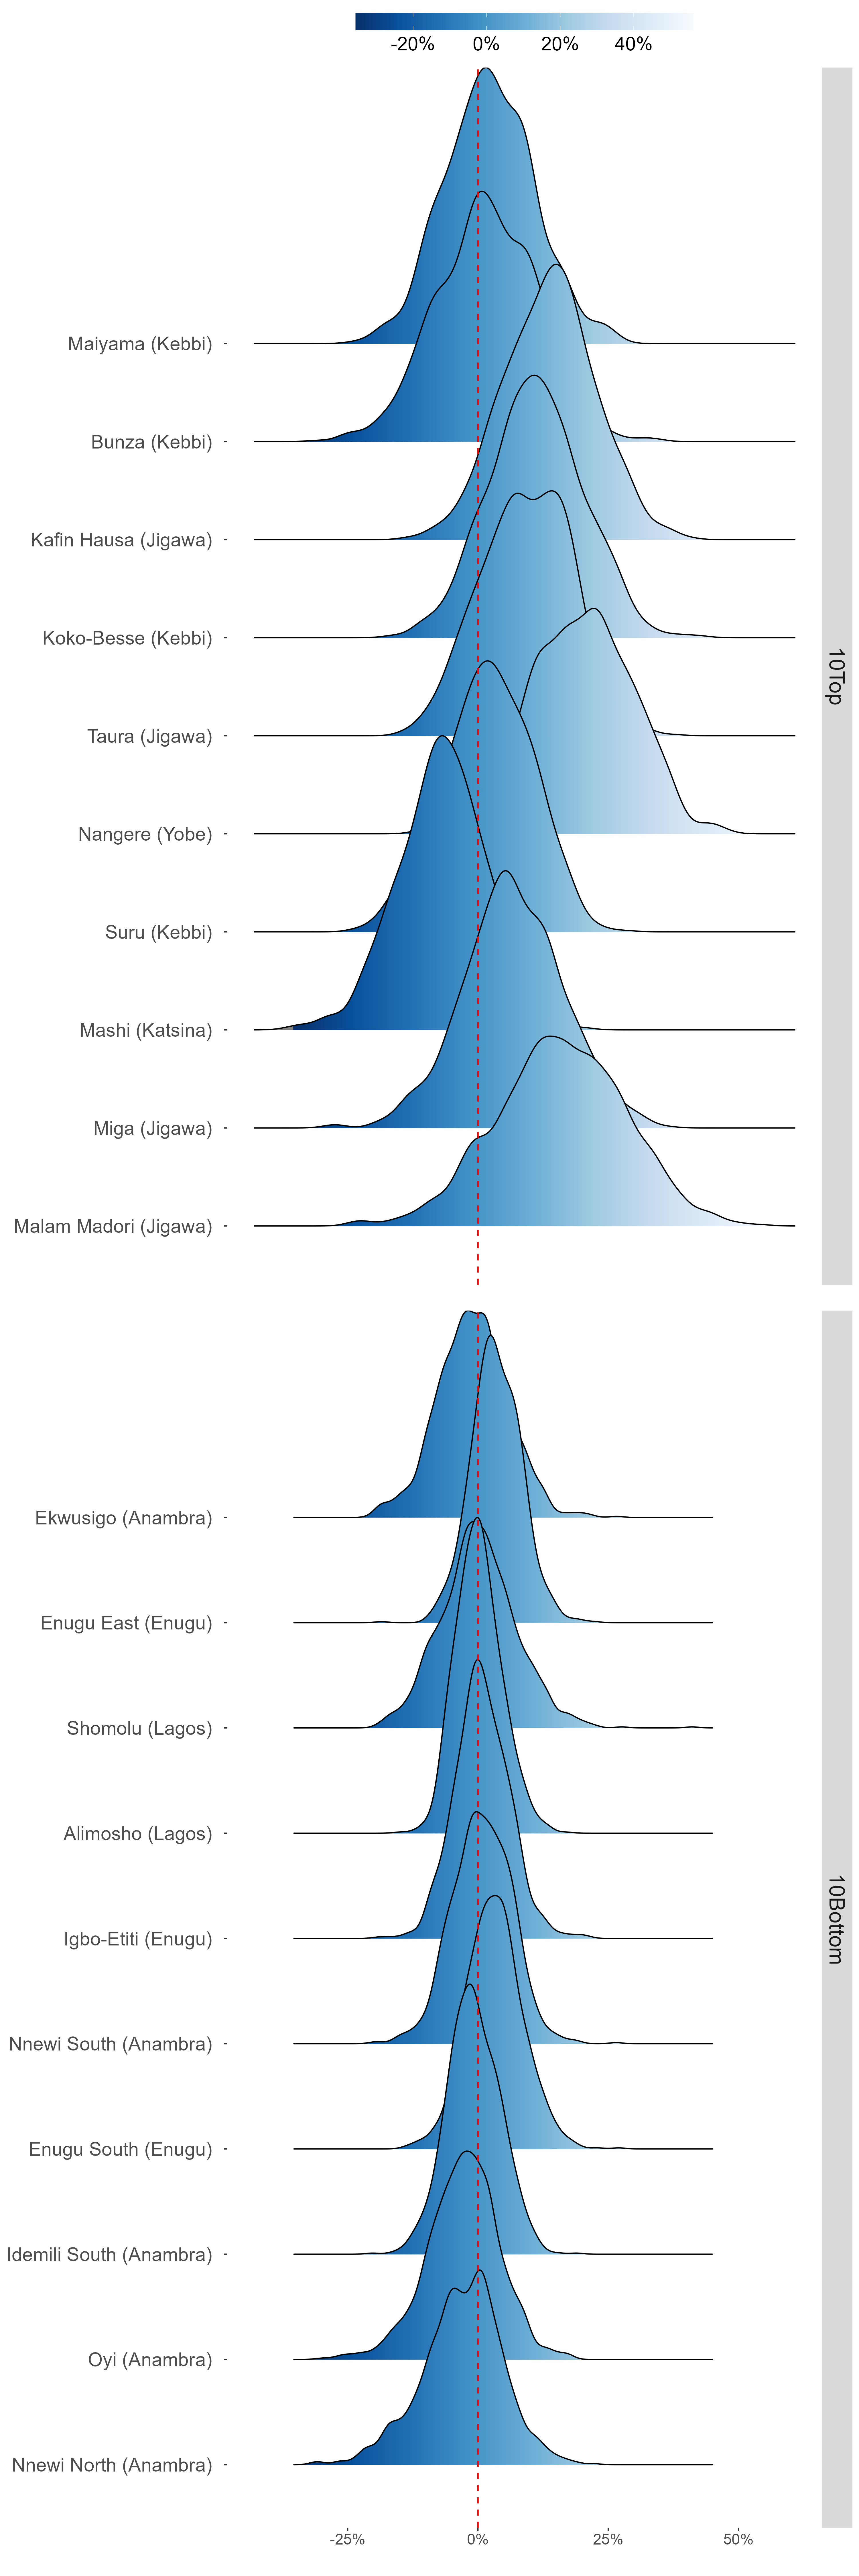
Ridge Plot
Latest states estimates
States change since Baseline


Latest LGA estimates
LGA change since Baseline

