Children who received no vaccinations
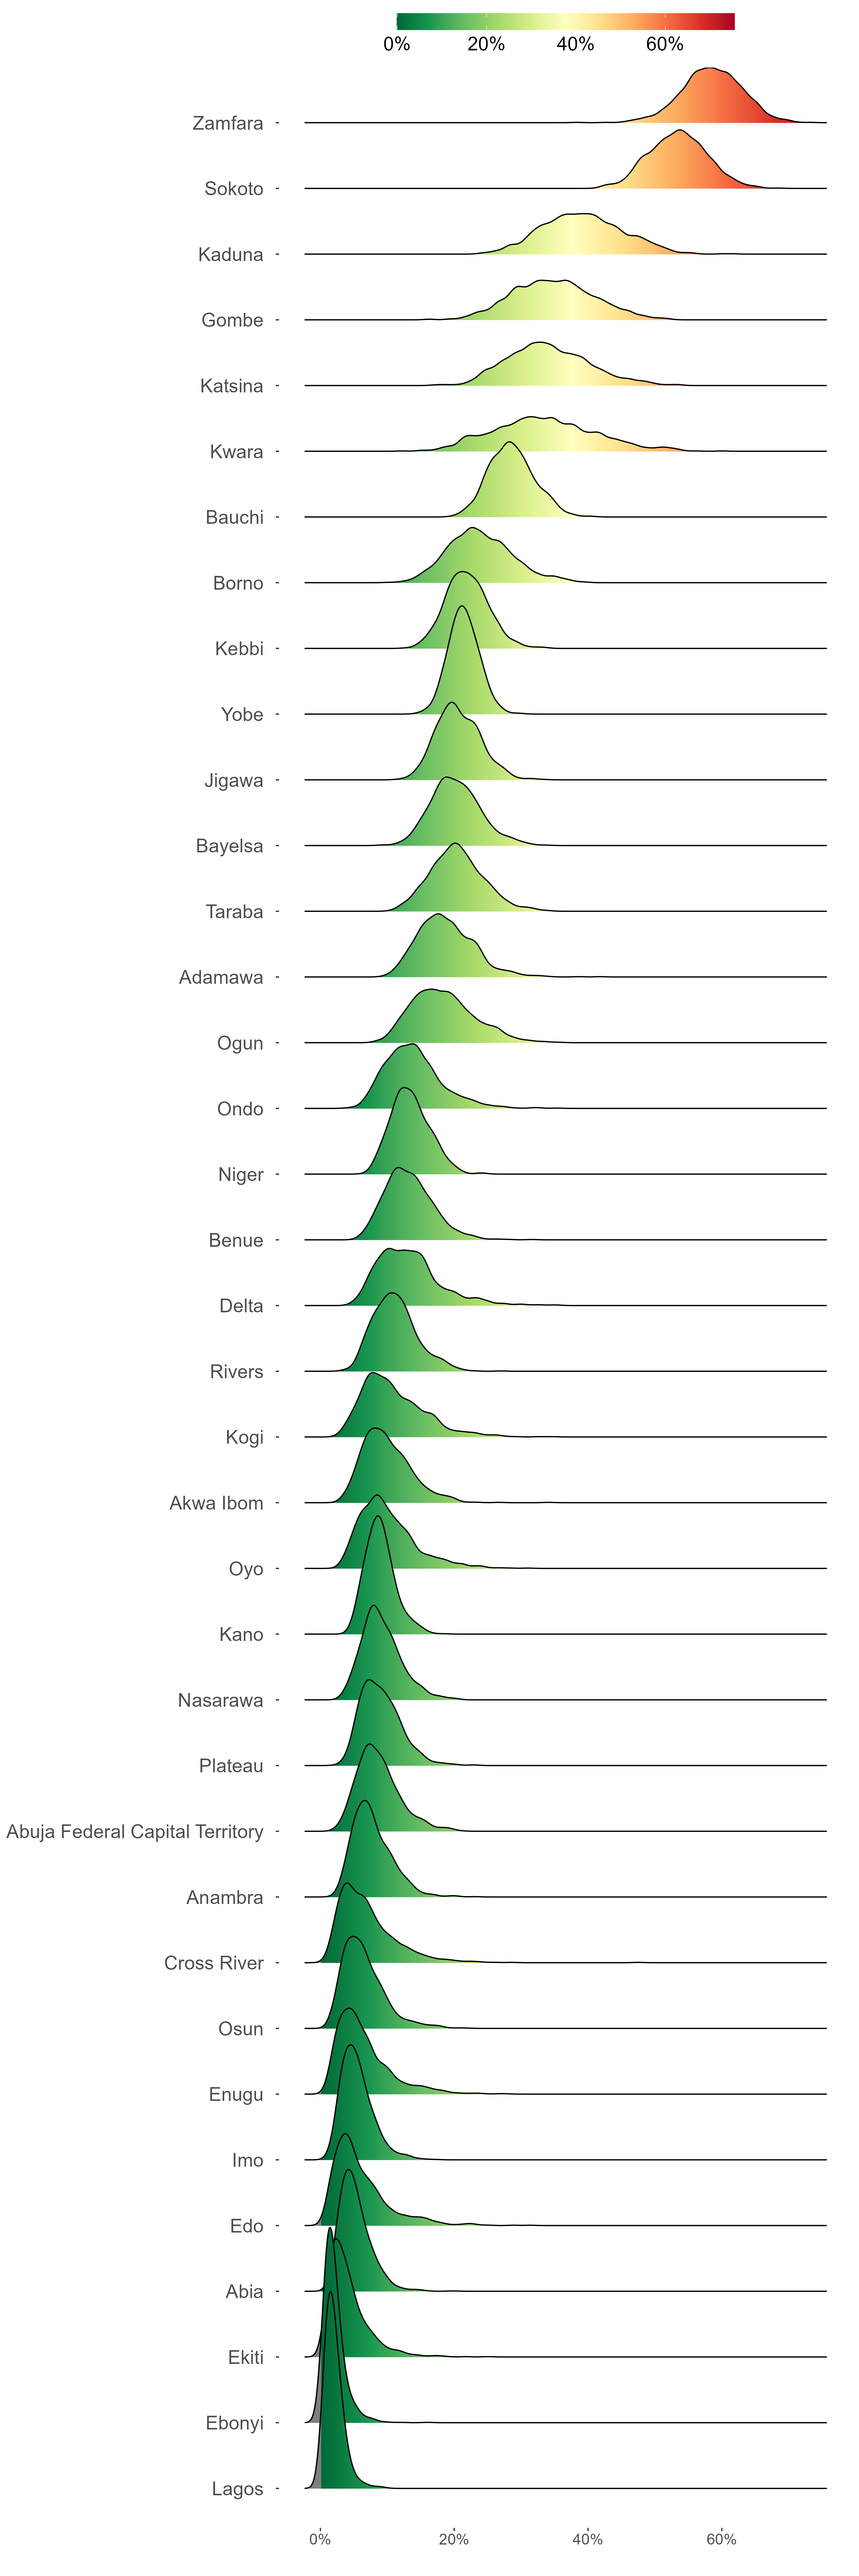
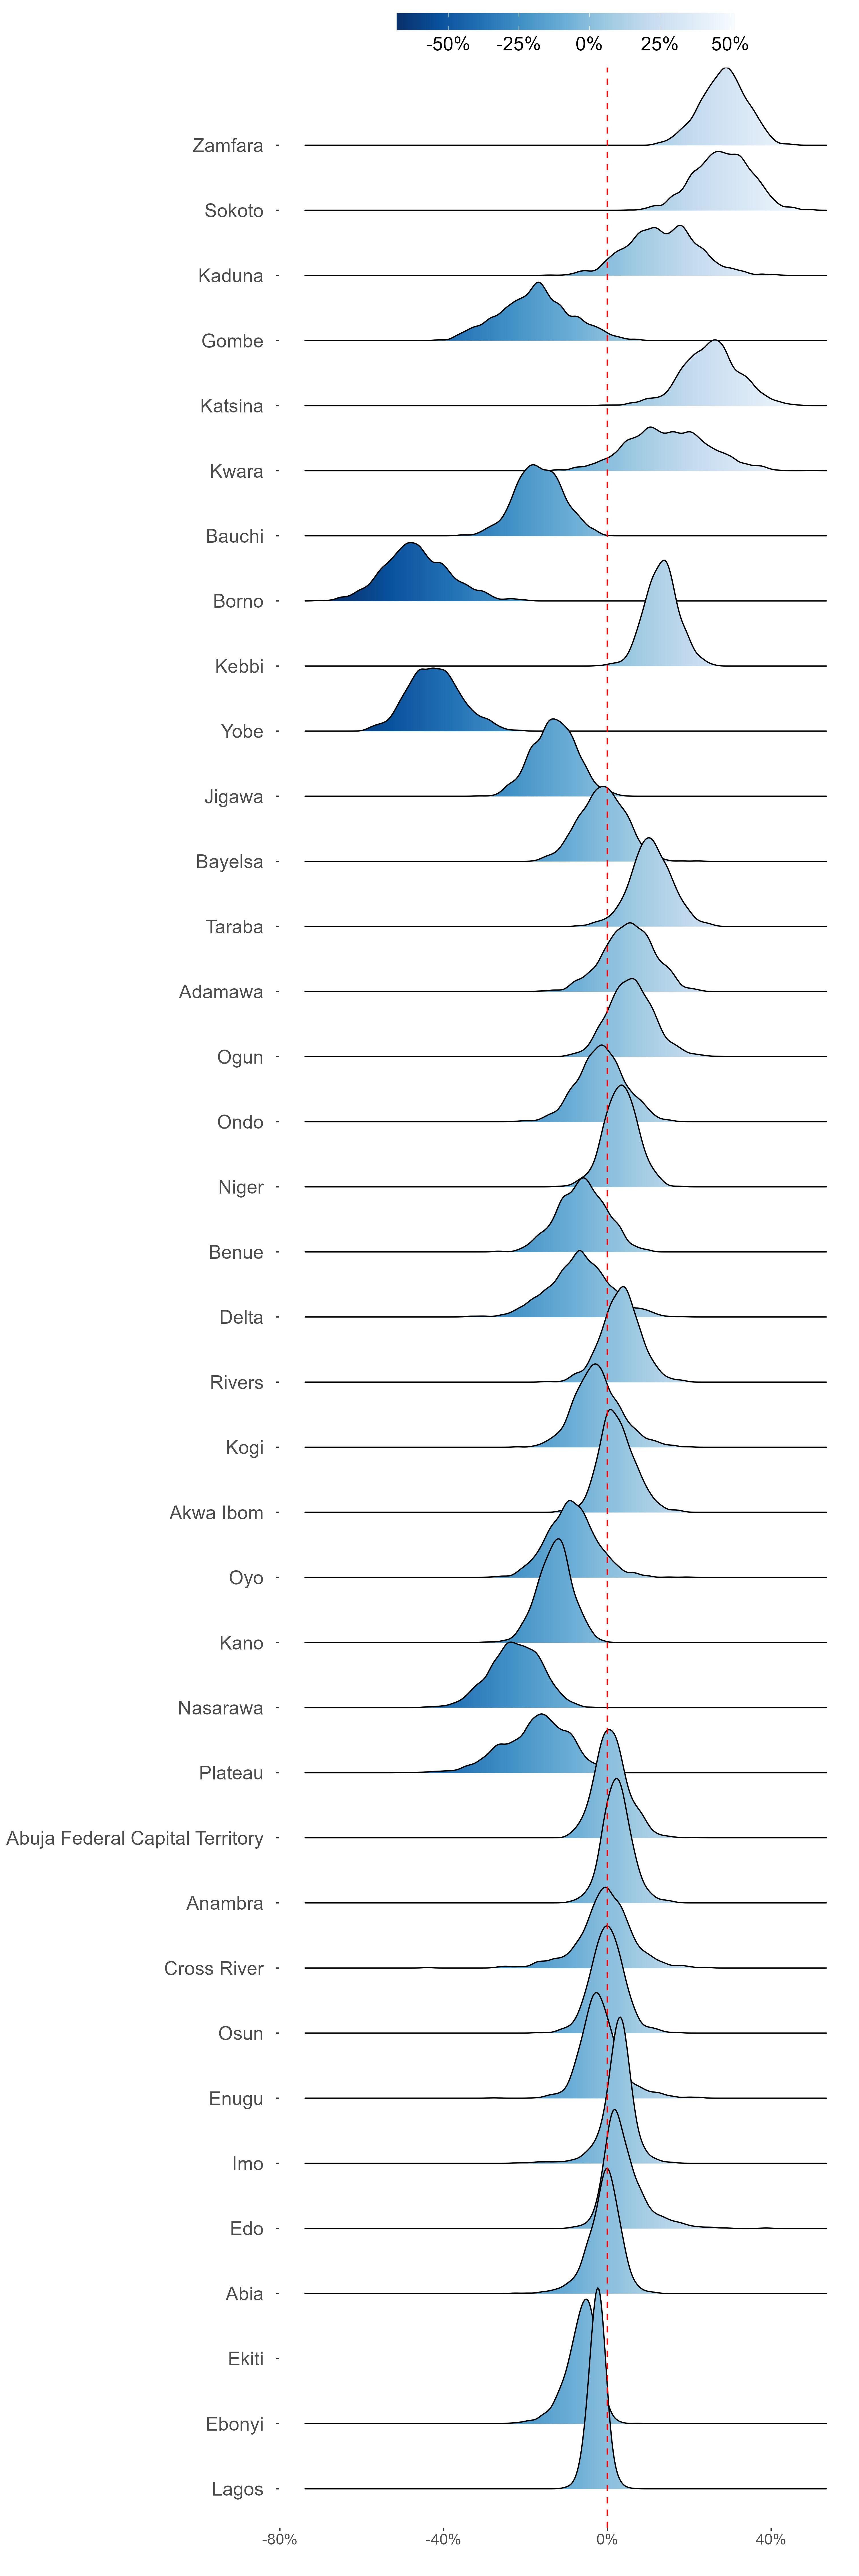
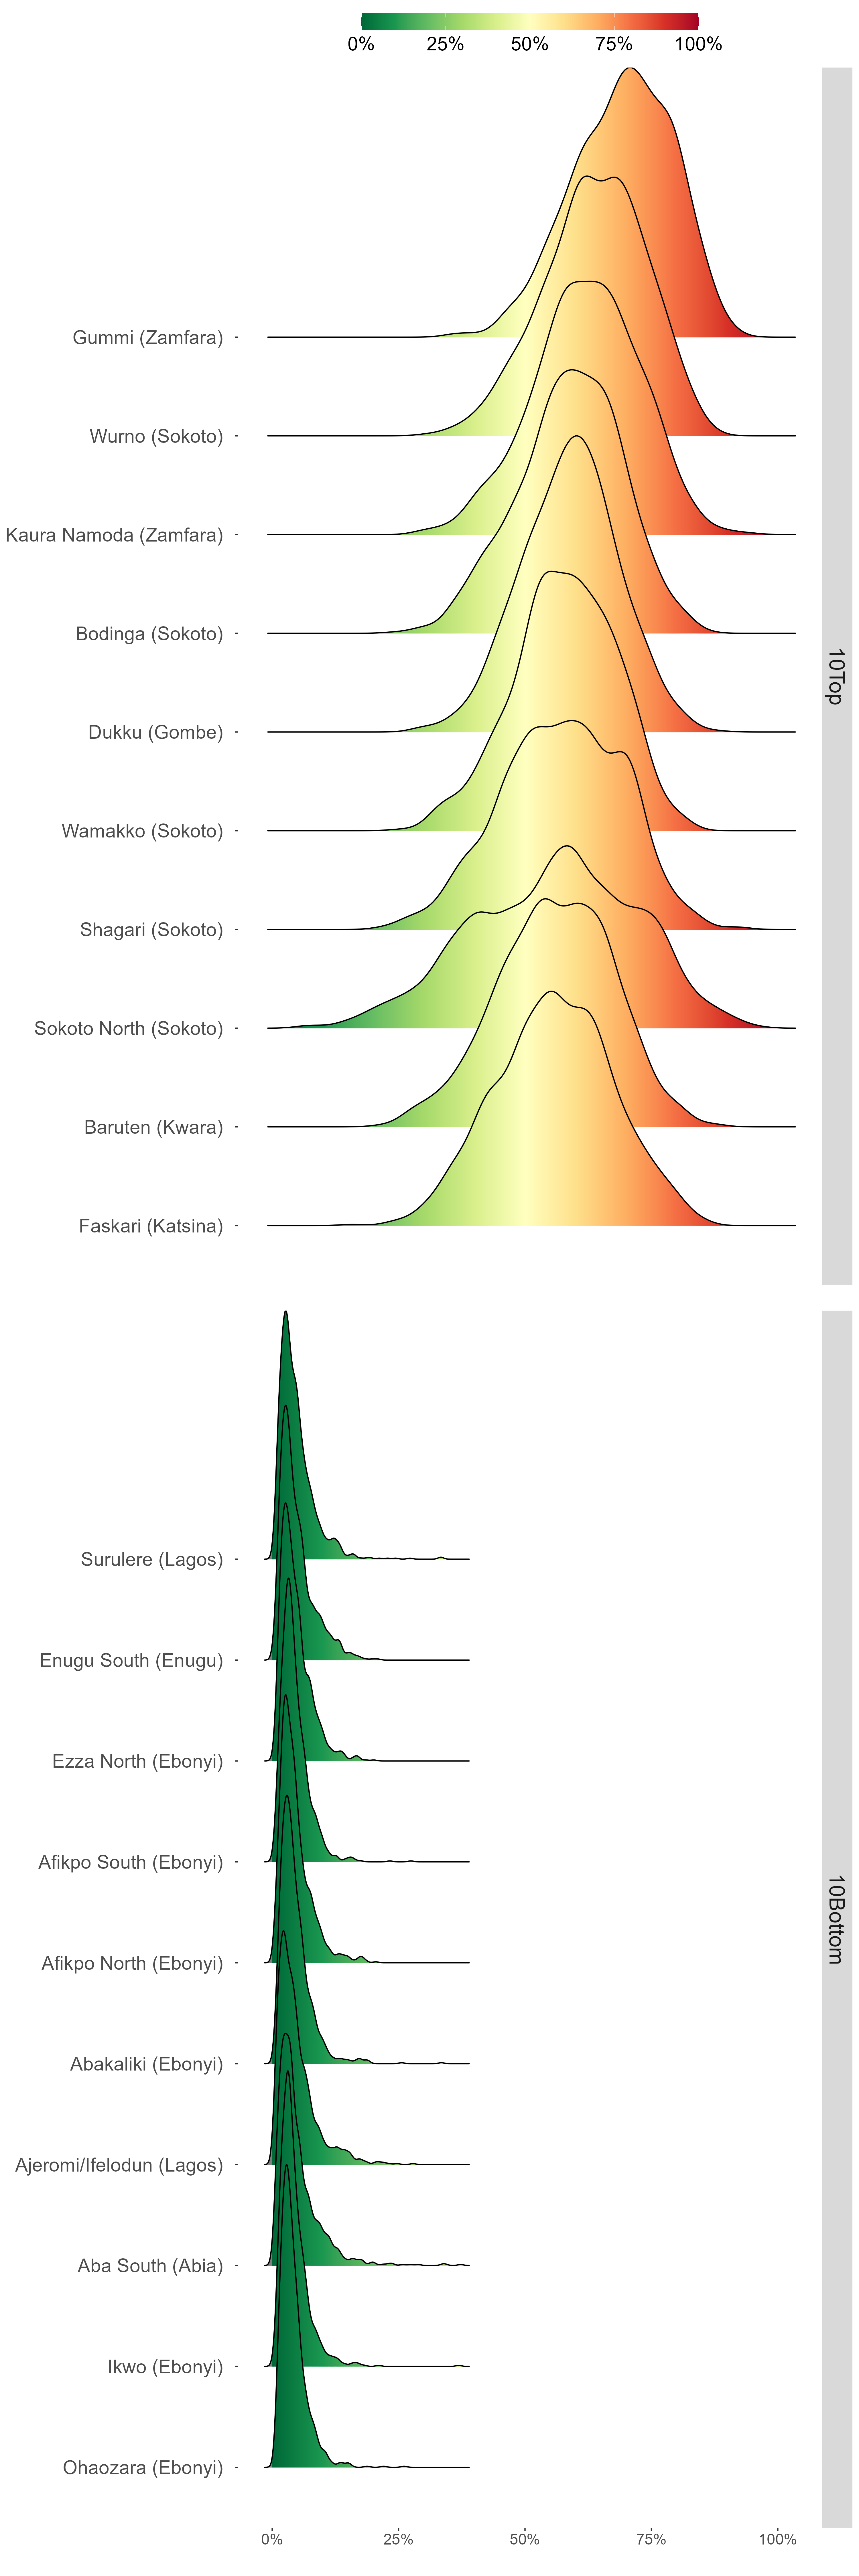
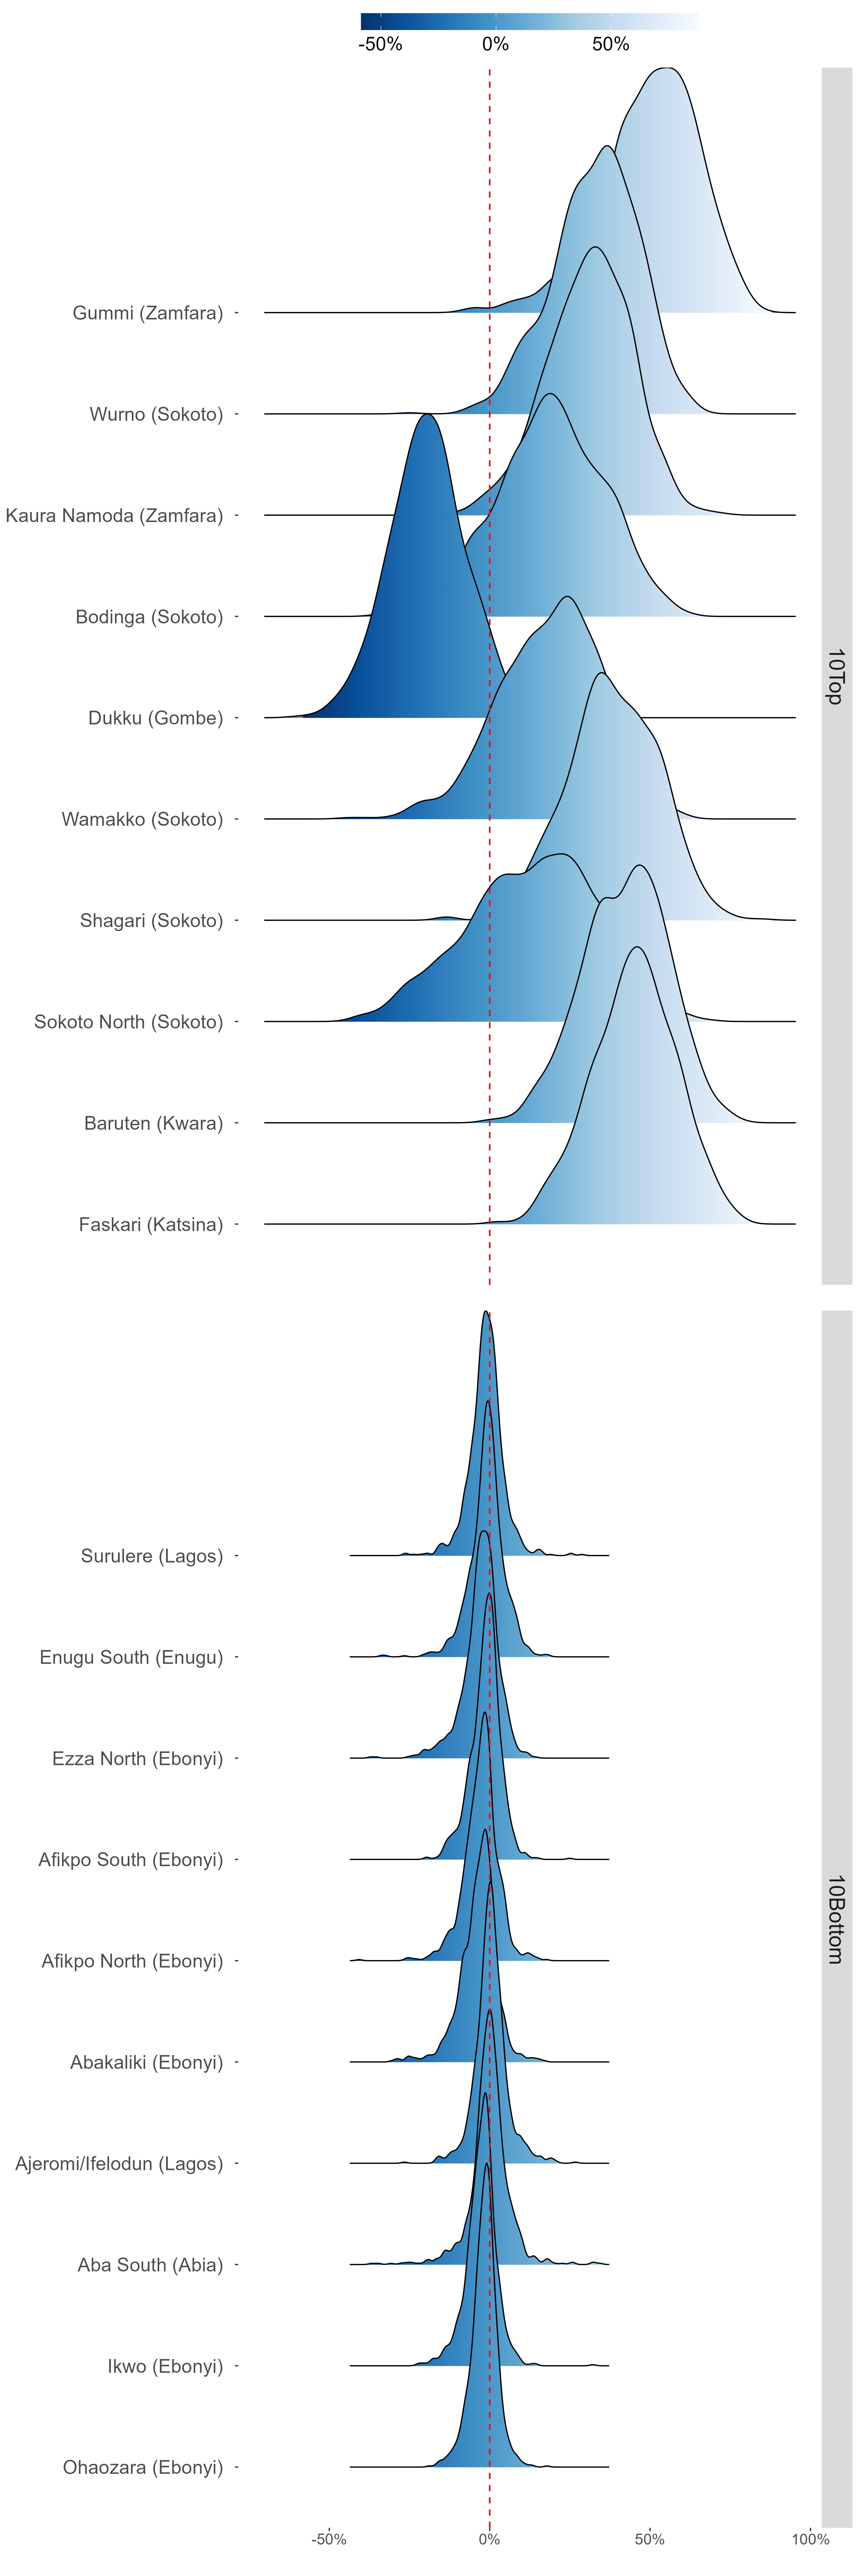
This indicator represents the percentage of children 12-23 months with no vaccinations
Prevalence map
Baseline
Latest
2018
2024
Width of 90% Confidence Interval
Baseline
Latest
2018
2024
Ridge Plot
Latest states estimates
States change since Baseline


Latest LGA estimates
LGA change since Baseline

