Wasting Rate
This indicator represents the percentage of children wasted (below -2 SD of weight for height according to the WHO standard)
Prevalence map
Baseline
Latest
2014
2022
Width of 90% Confidence Interval
Baseline
Latest
2014
2022
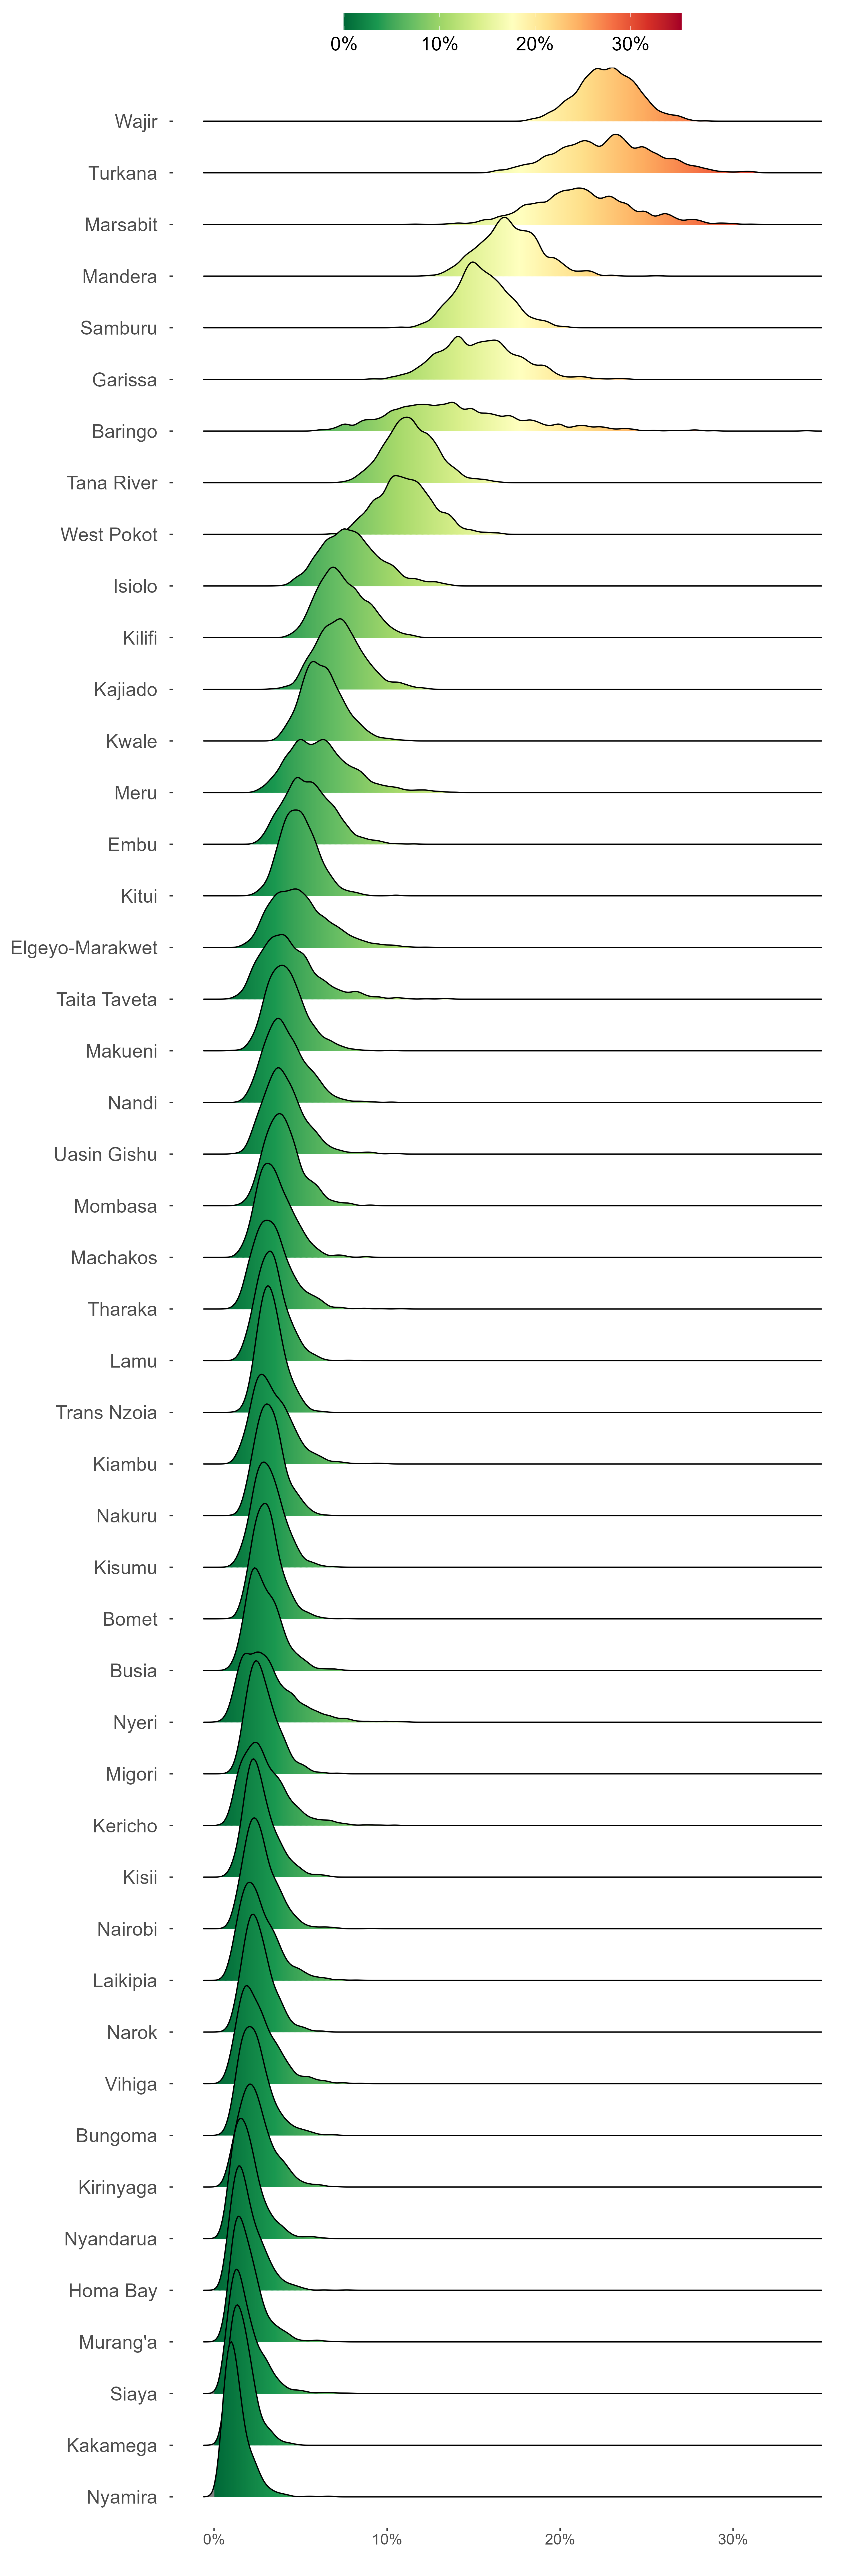
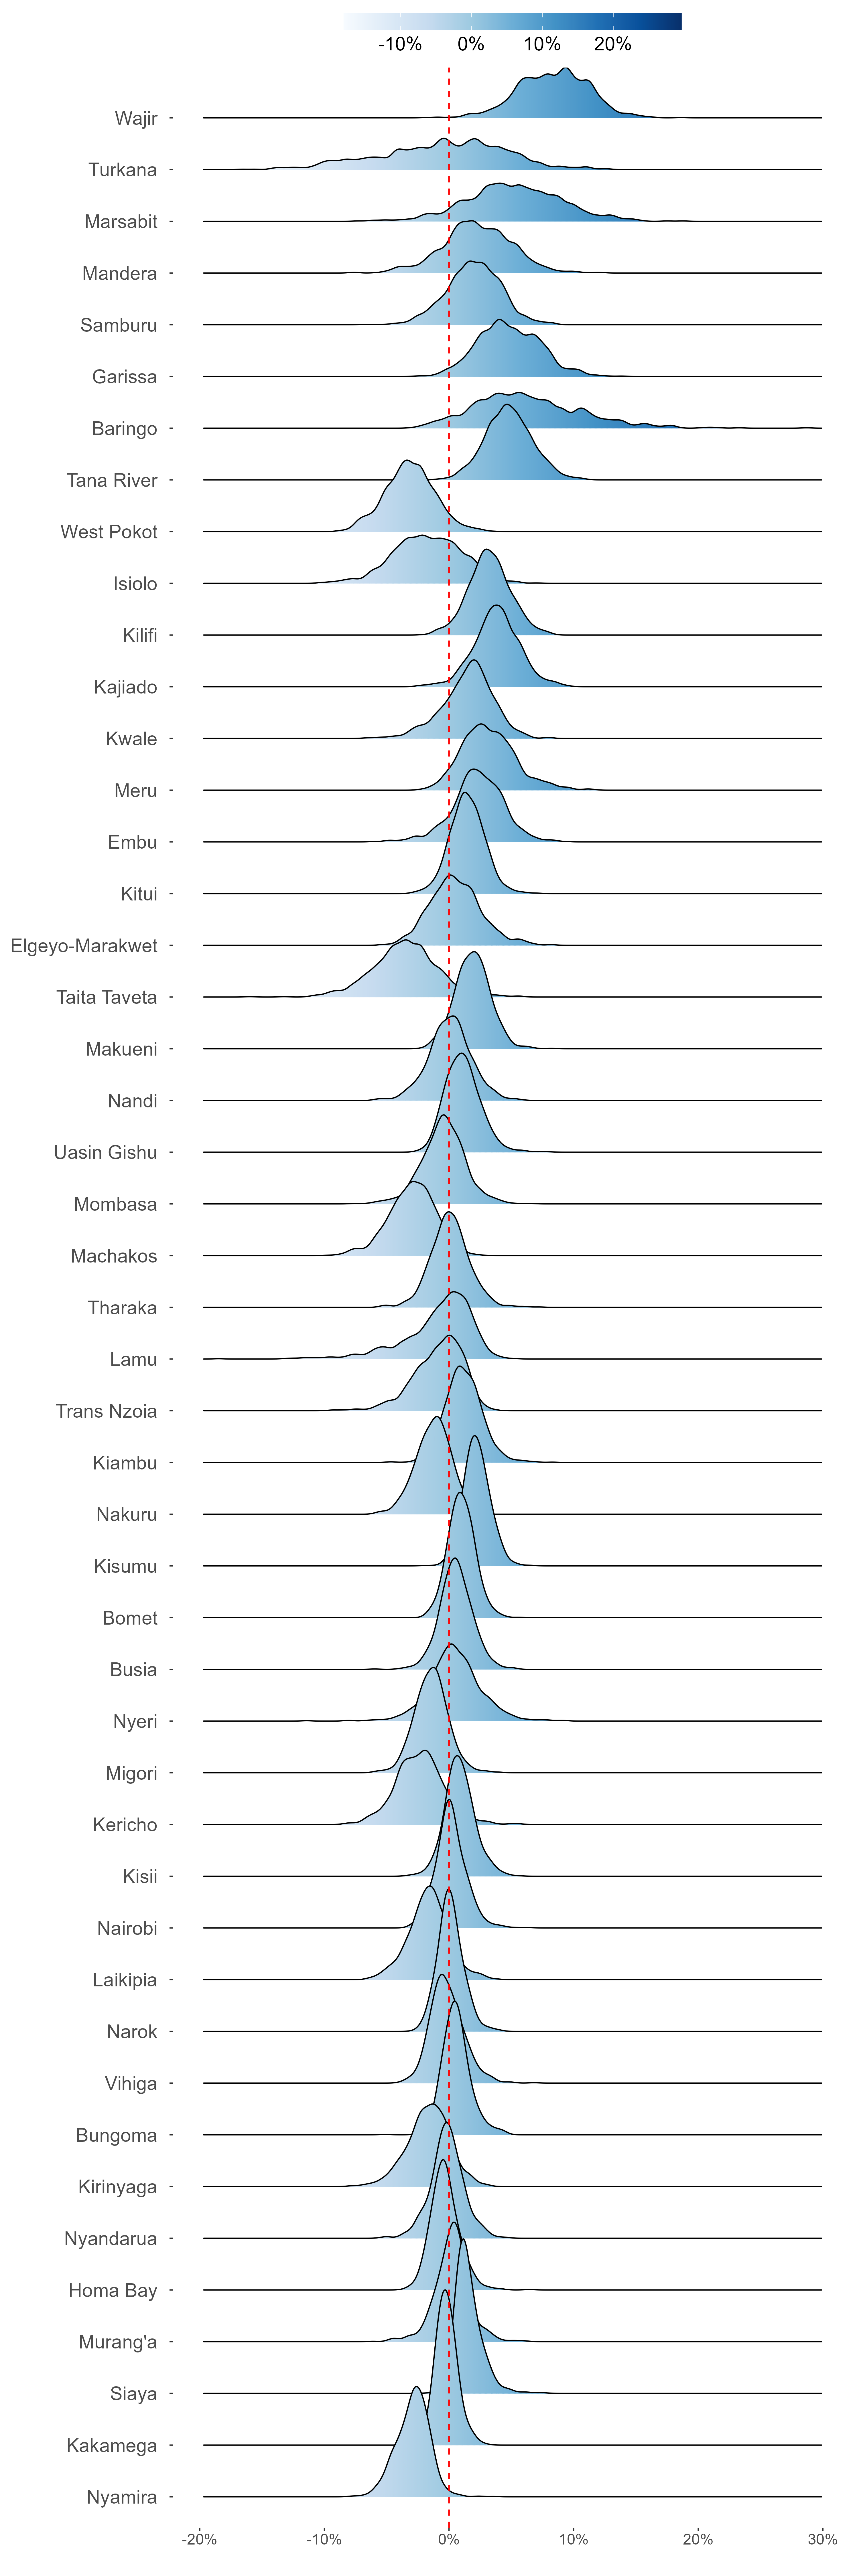
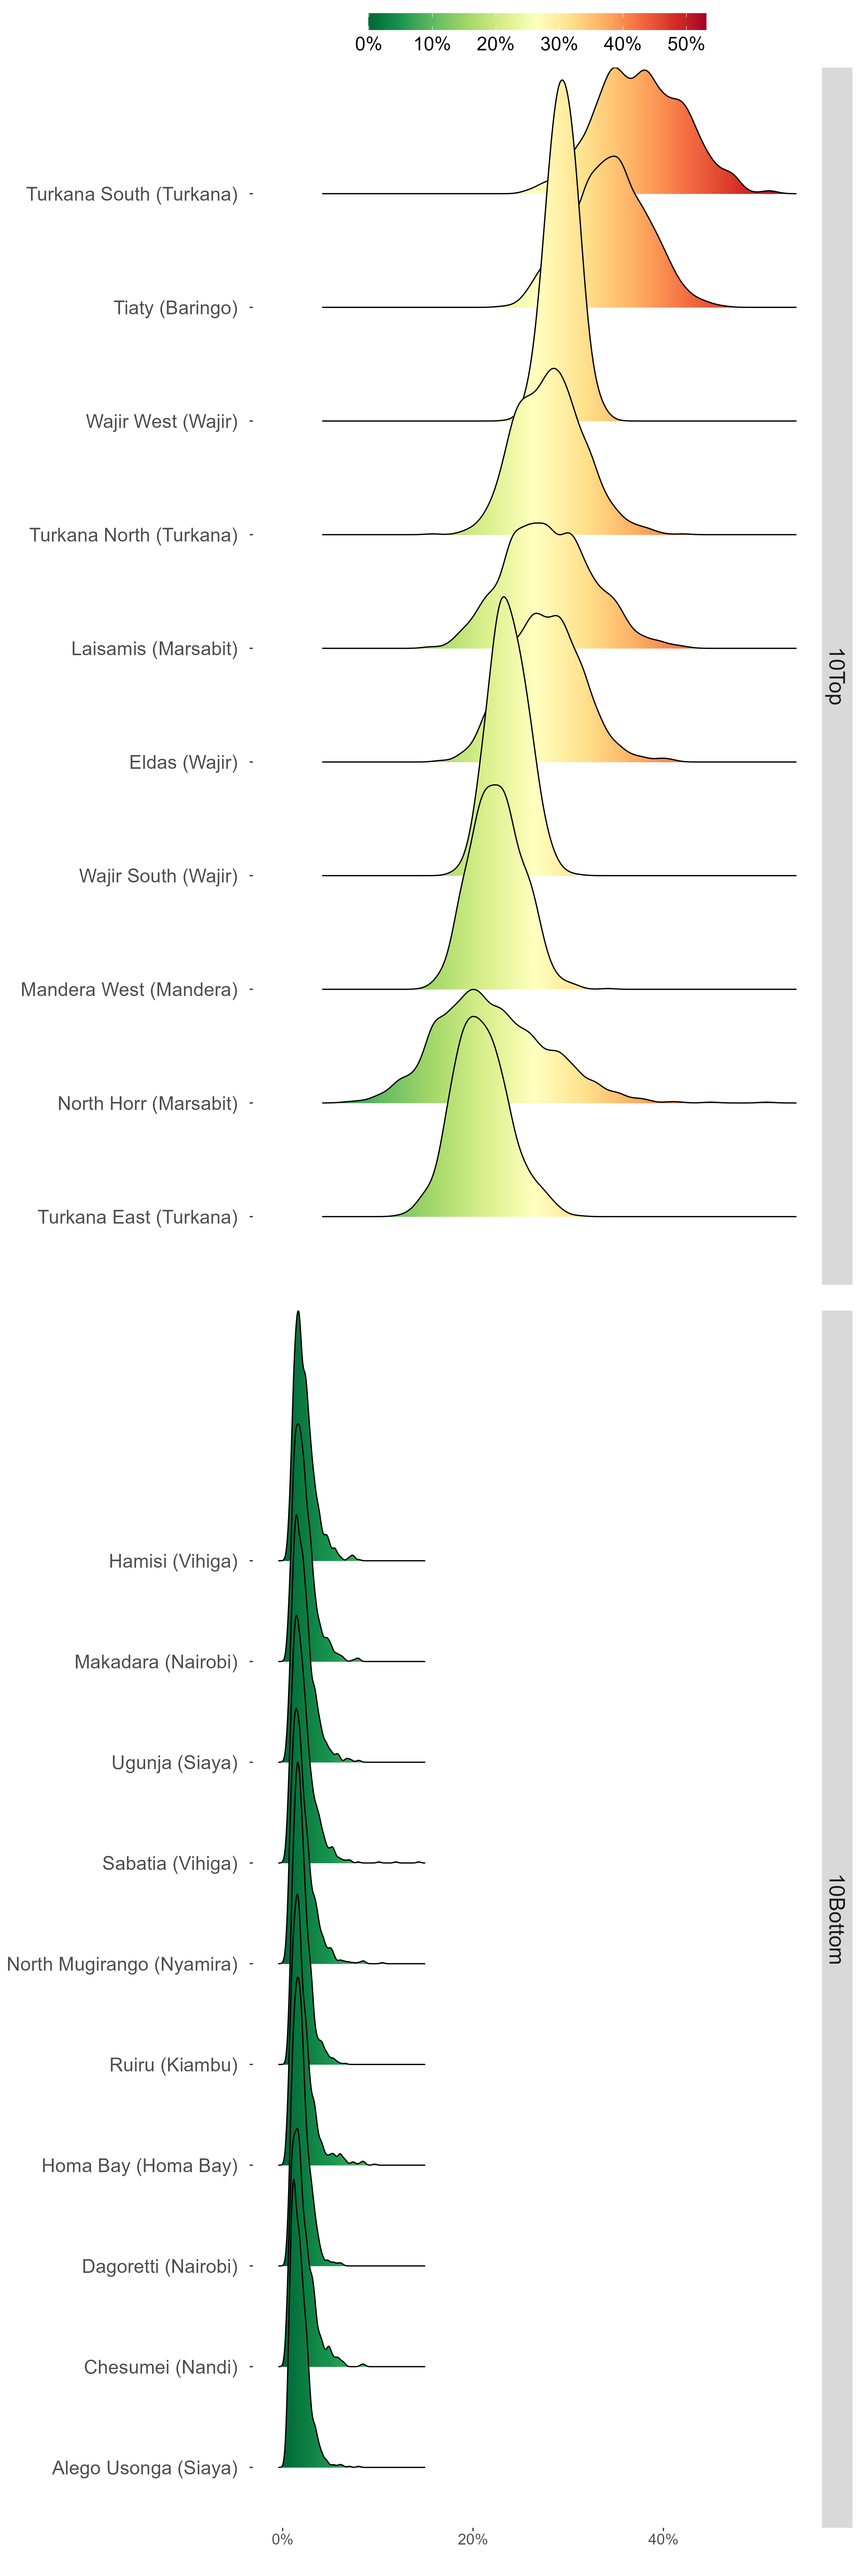
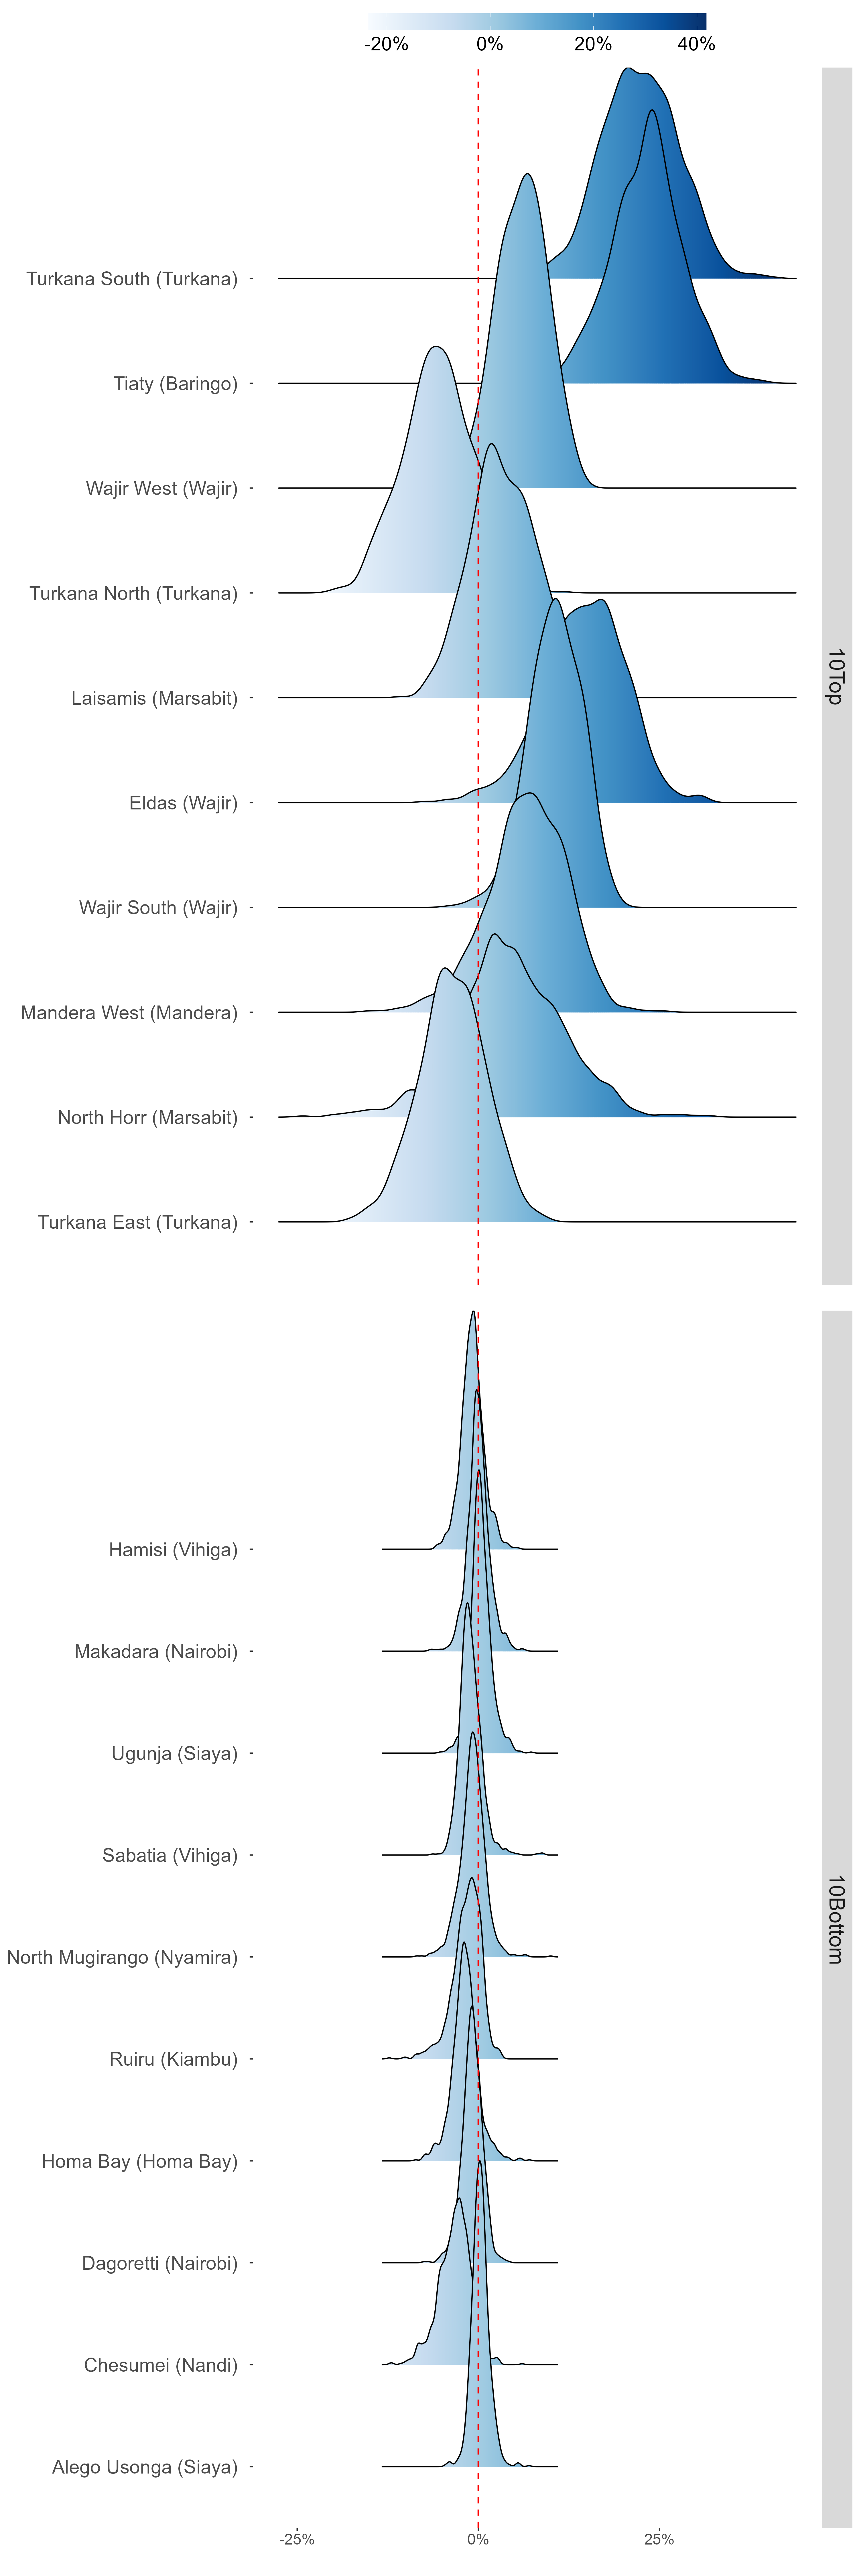
Ridge Plot
Latest counties estimates
Counties change since Baseline


Latest sub-counties estimates
Sub-counties change since Baseline

